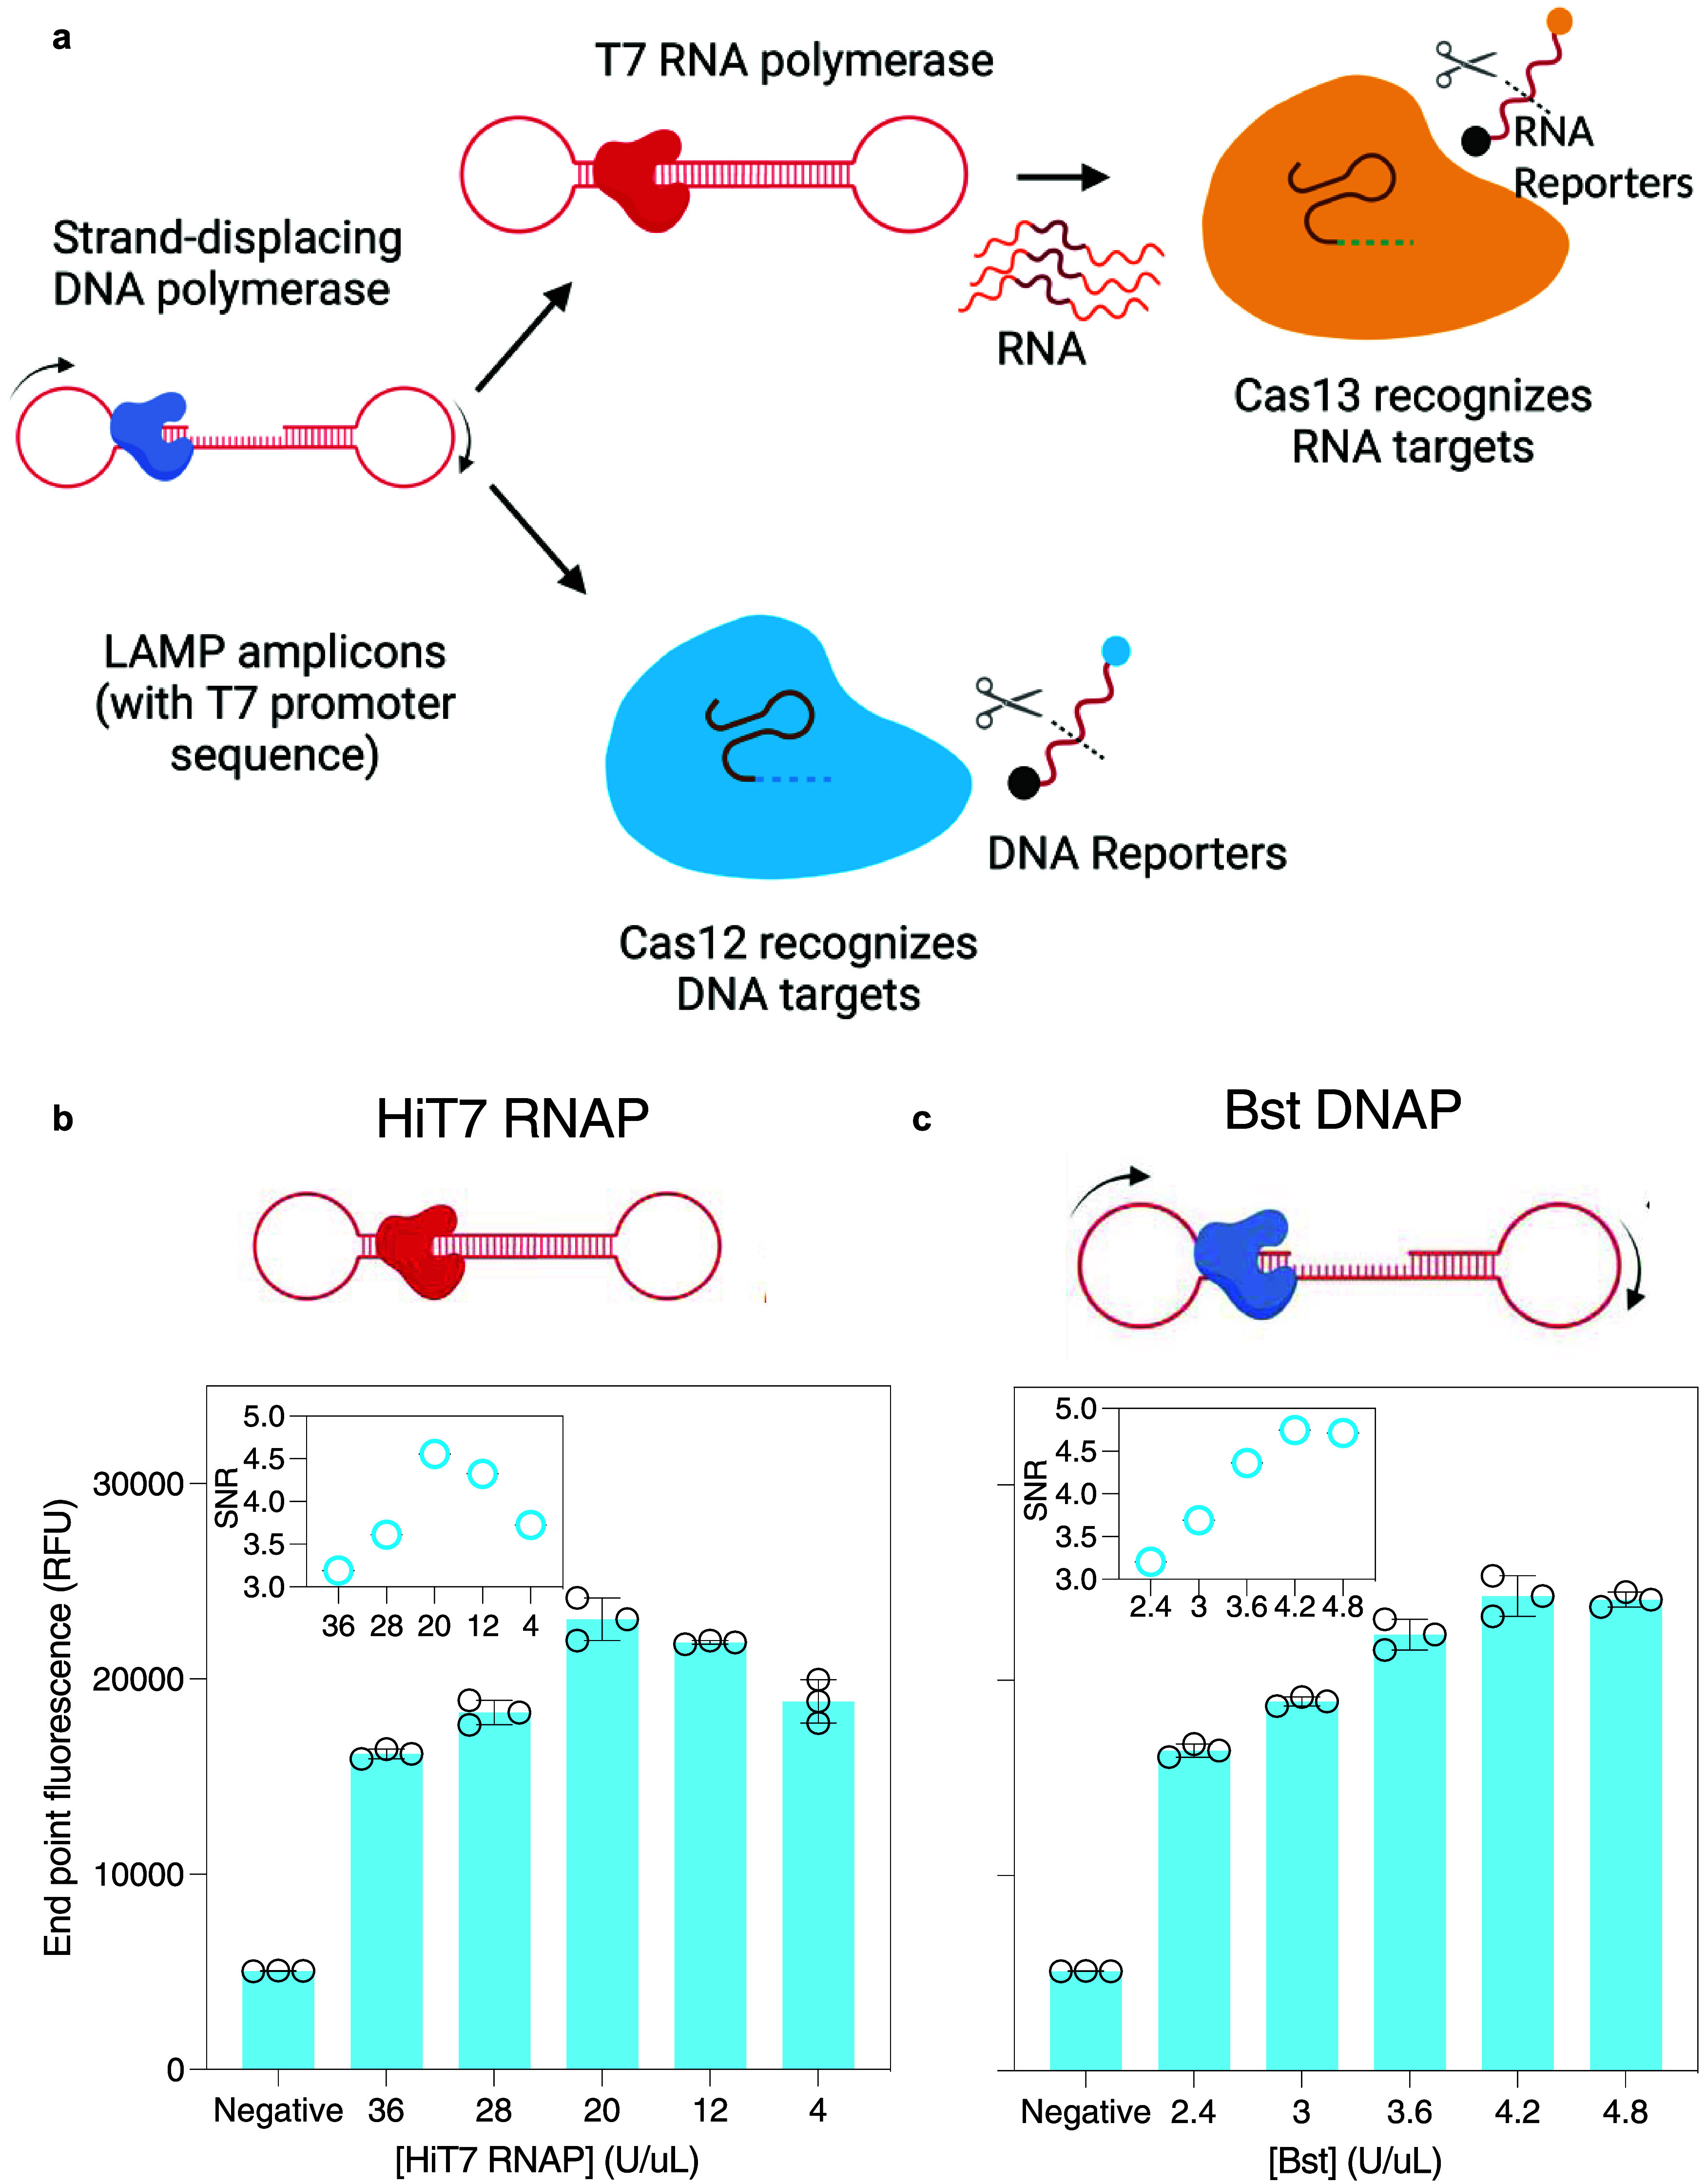
Figure 2.

Optimization of CRISPRD single-target reaction chemistry. (a) Schematic of single target detection. The target is amplified by LAMP and either detected directly by Cas12b or transcribed to RNA then detected by TccCas13a or HheCas13a. (e, f) Optimizing the CRISPRD detection chemistry by optimizing the concentration of HiT7 RNA polymerase (RNAP) (e) and Bst DNA polymerase (f). Testing was done with TccCas13a on the RNase P target (4 ng/reaction). The signal-to-noise ratio (SNR), calculated by dividing the signal over the background (reactions lacking a target), is displayed in the inset in both figures. NTC: no template control, RNP: Ribonucleoprotein, one cycle = 2 min. The unlabeled y-axis follows the labeling of the y-axis in the left figure. All reactions were done in triplicate, and mean and standard deviation were plotted.
