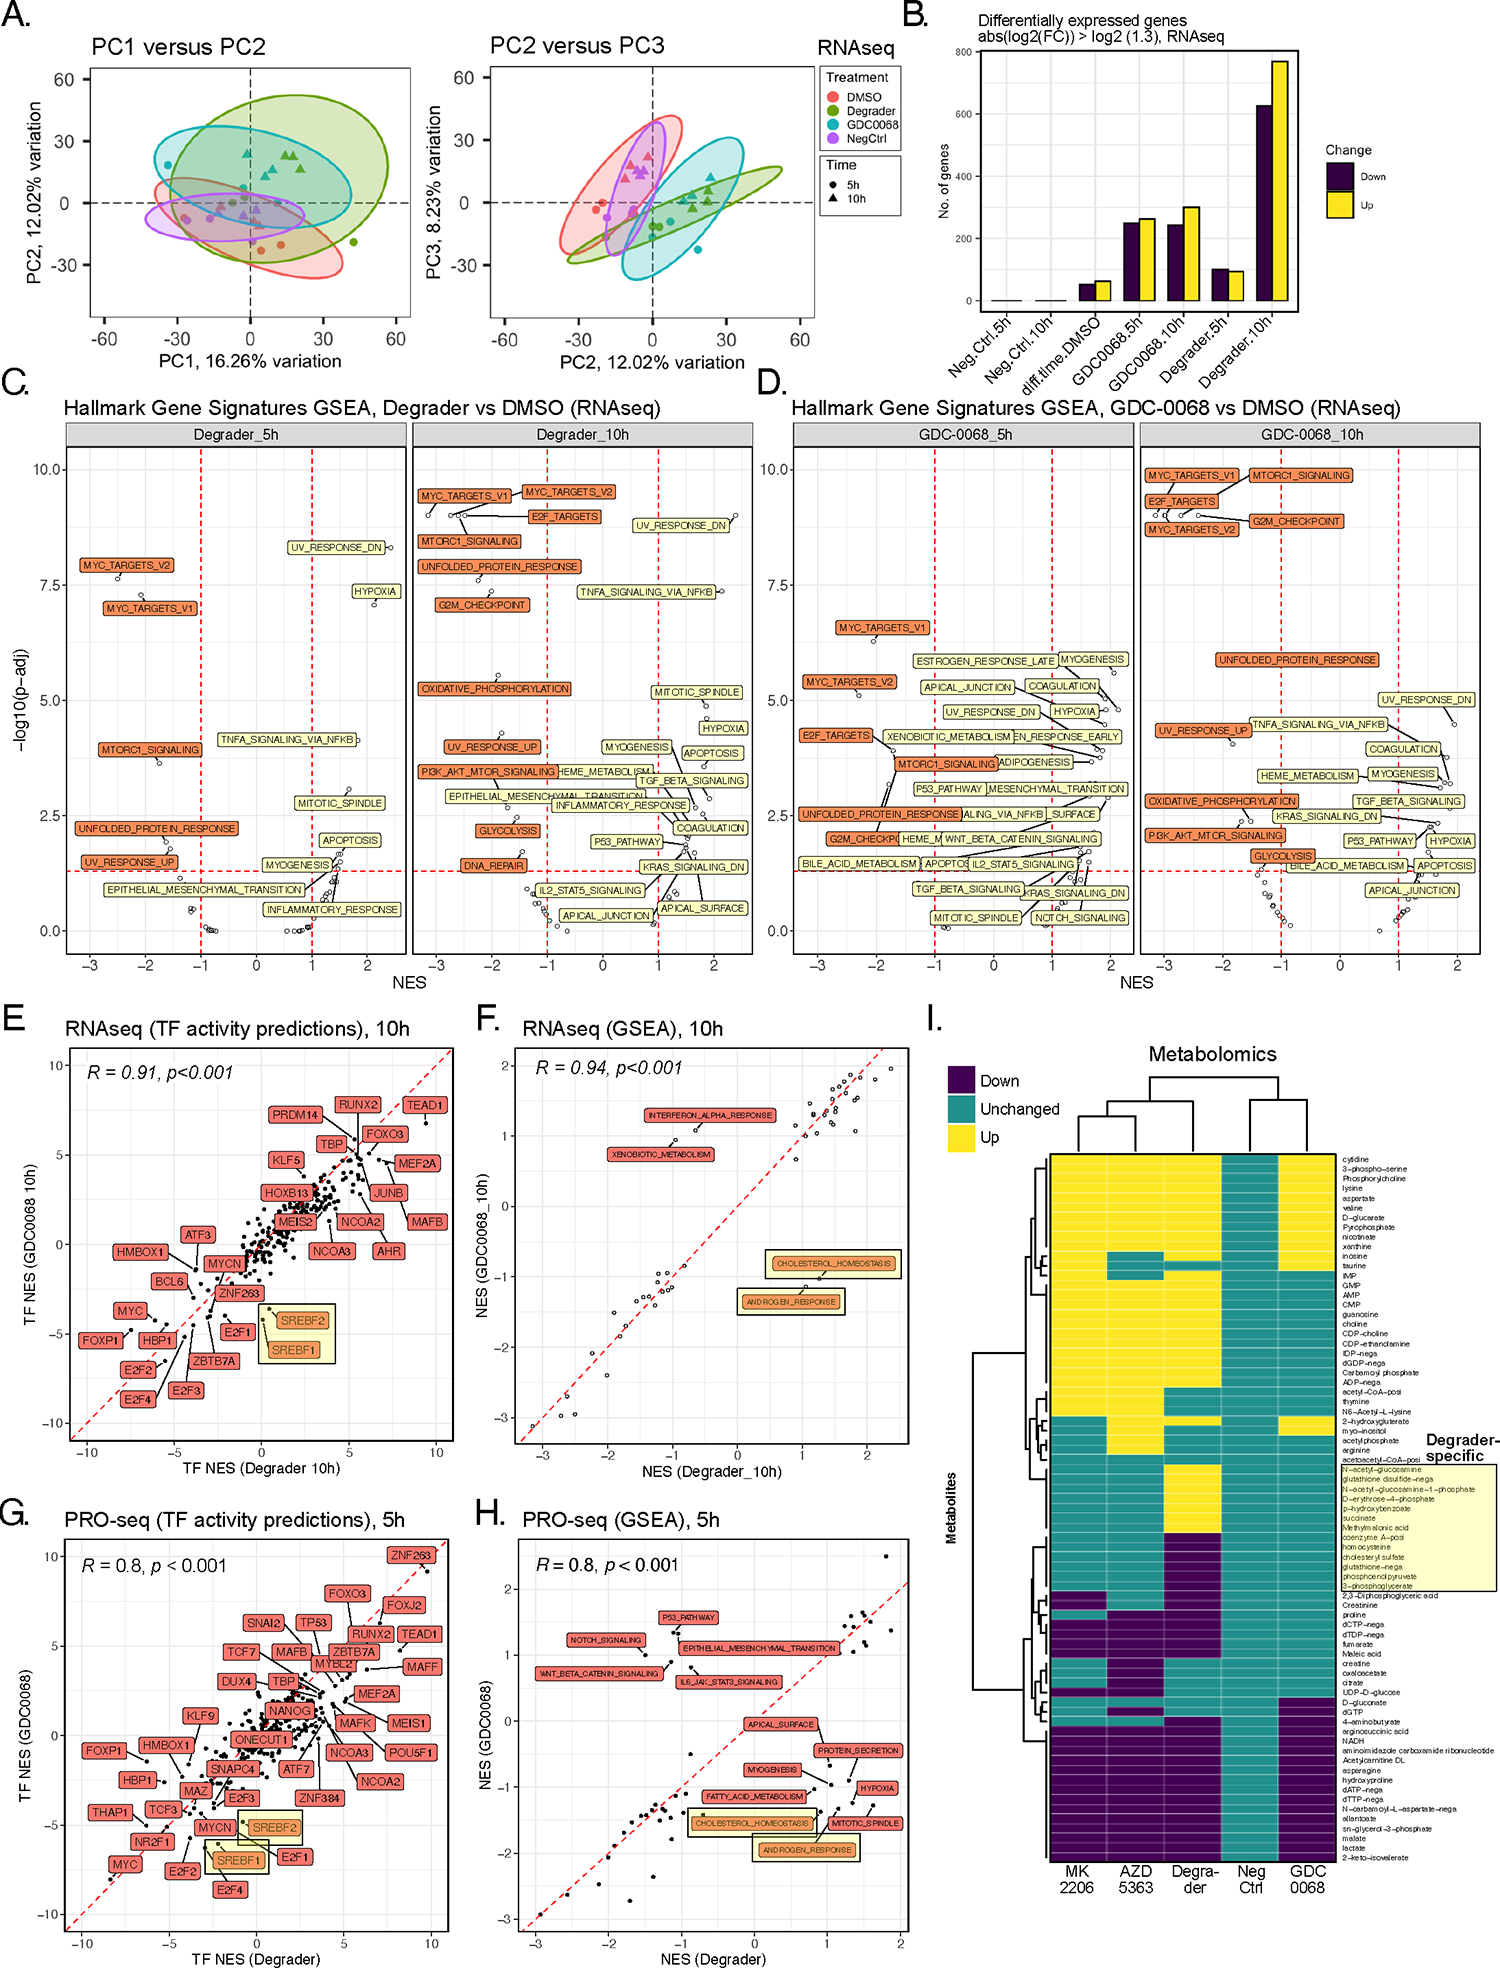
Figure 2. Multiomic profiling of INY-05–040 and GDC-0068 in T47D breast cancer cells.

(A) Principal component analysis (PCA) projection of the transcriptomic dataset, comprising n=3 biological replicates per treatment (DMSO; degrader: 100 nM INY-05–040; 500 nM GDC-0068; NegCtrl: 100 nM INY-05–040-Neg) and time point (5 h and 10 h). Ellipses are drawn around each group at 95 % confidence level. The first three independent axes (PCs) of highest variation are shown. (B) Number of differentially up- and downregulated transcripts (absolute fold-change ≥ 1.3) following differential gene expression analysis (FDR ≤ 0.05) across the indicated comparisons. Comparisons are relative to the corresponding DMSO-treated control; for example, Neg.Ctrl.10h refers to the effect of 10 h treatment with INY-05–040-Neg vs 10 h treatment with DMSO. The exception is “diff.time.DMSO” which evaluates differential expression as a function of time in culture (treatment with DMSO for 10 h versus treatment with DMSO for 5 h). (C and D) Gene set enrichment analysis (GSEA) on the mSigDb HALLMARK collection, based on the ranked t values from all genes for the indicated treatments relative to the corresponding DMSO-treated controls. Gene sets are labelled if the absolute normalized enrichment score (NES) exceeds 1 and the adjusted p-value falls below 0.05 (FDR). (E) Spearman’s correlation analysis of transcription factor (TF) activity predictions from RNAseq data in cells treated for 10 h with either degrader or GDC-0068. TF footprint analyses were performed with DoRothEA. SREBF1 (protein name: SREBP1) and SREBF2 (protein name: SREBP2) activity predictions are highlighted due to their divergence between degrader and GDC-0068-treated cells, with lower activity predictions observed only in GDC-0068-treated cells. (F) Spearman’s correlation analysis of GSEA-derived NES for individual HALLMARK gene sets, based on RNAseq data from cells treated for 10 h with either degrader or GDC-0068. “CHOLESTEROL HOMEOSTASIS” and “ANDROGEN RESPONSE” hallmark gene sets are highlighted as having positive and negative NES in Degrader- and GDC-0068-treated cells, respectively. (G) Spearman’s correlation analysis of transcription factor (TF) activity predictions from PRO-seq data in T47D cells treated for 5 hours with either degrader and GDC-0068 relative to DMSO-treated control. TF activity predictions were calculated from t values from all genes following differential gene expression analysis (FDR ≤ 0.05; n = 2 biological replicates per treatment). (H) Spearman’s correlation analysis of GSEA-derived NES for individual HALLMARK gene sets, based on PROseq data from (G). (I) Hierarchical clustering (Euclidean distance) of differential metabolite abundance (FDR ≤ 0.05) following 24-h treatments of T47D with either AZD 5383 (capivasertib; catalytic pan-AKT inhibitor; 2 μM), degrader (INY-05–040; 100 nM), GDC-0068 (catalytic AKT inhibitor; 500–750 nM), MK2205 (allosteric pan-AKT inhibitor; 1 μM) or NegCtrl (INY-05–040-Neg; 100 nM). Differential abundance analysis was performed relative to DMSO-treated controls (n = 9 replicates per treatment, from 3 biological replicates with 3 technical replicates each). More than 85% of the observed differences in metabolite abundance for a given treatment corresponded to at least a 20% change relative to DMSO-treated cells. Metabolite levels that were changed only upon treatment with Degrader are highlighted. Additional supporting data related to this figure are included in Figs. S2, S3, S4.
