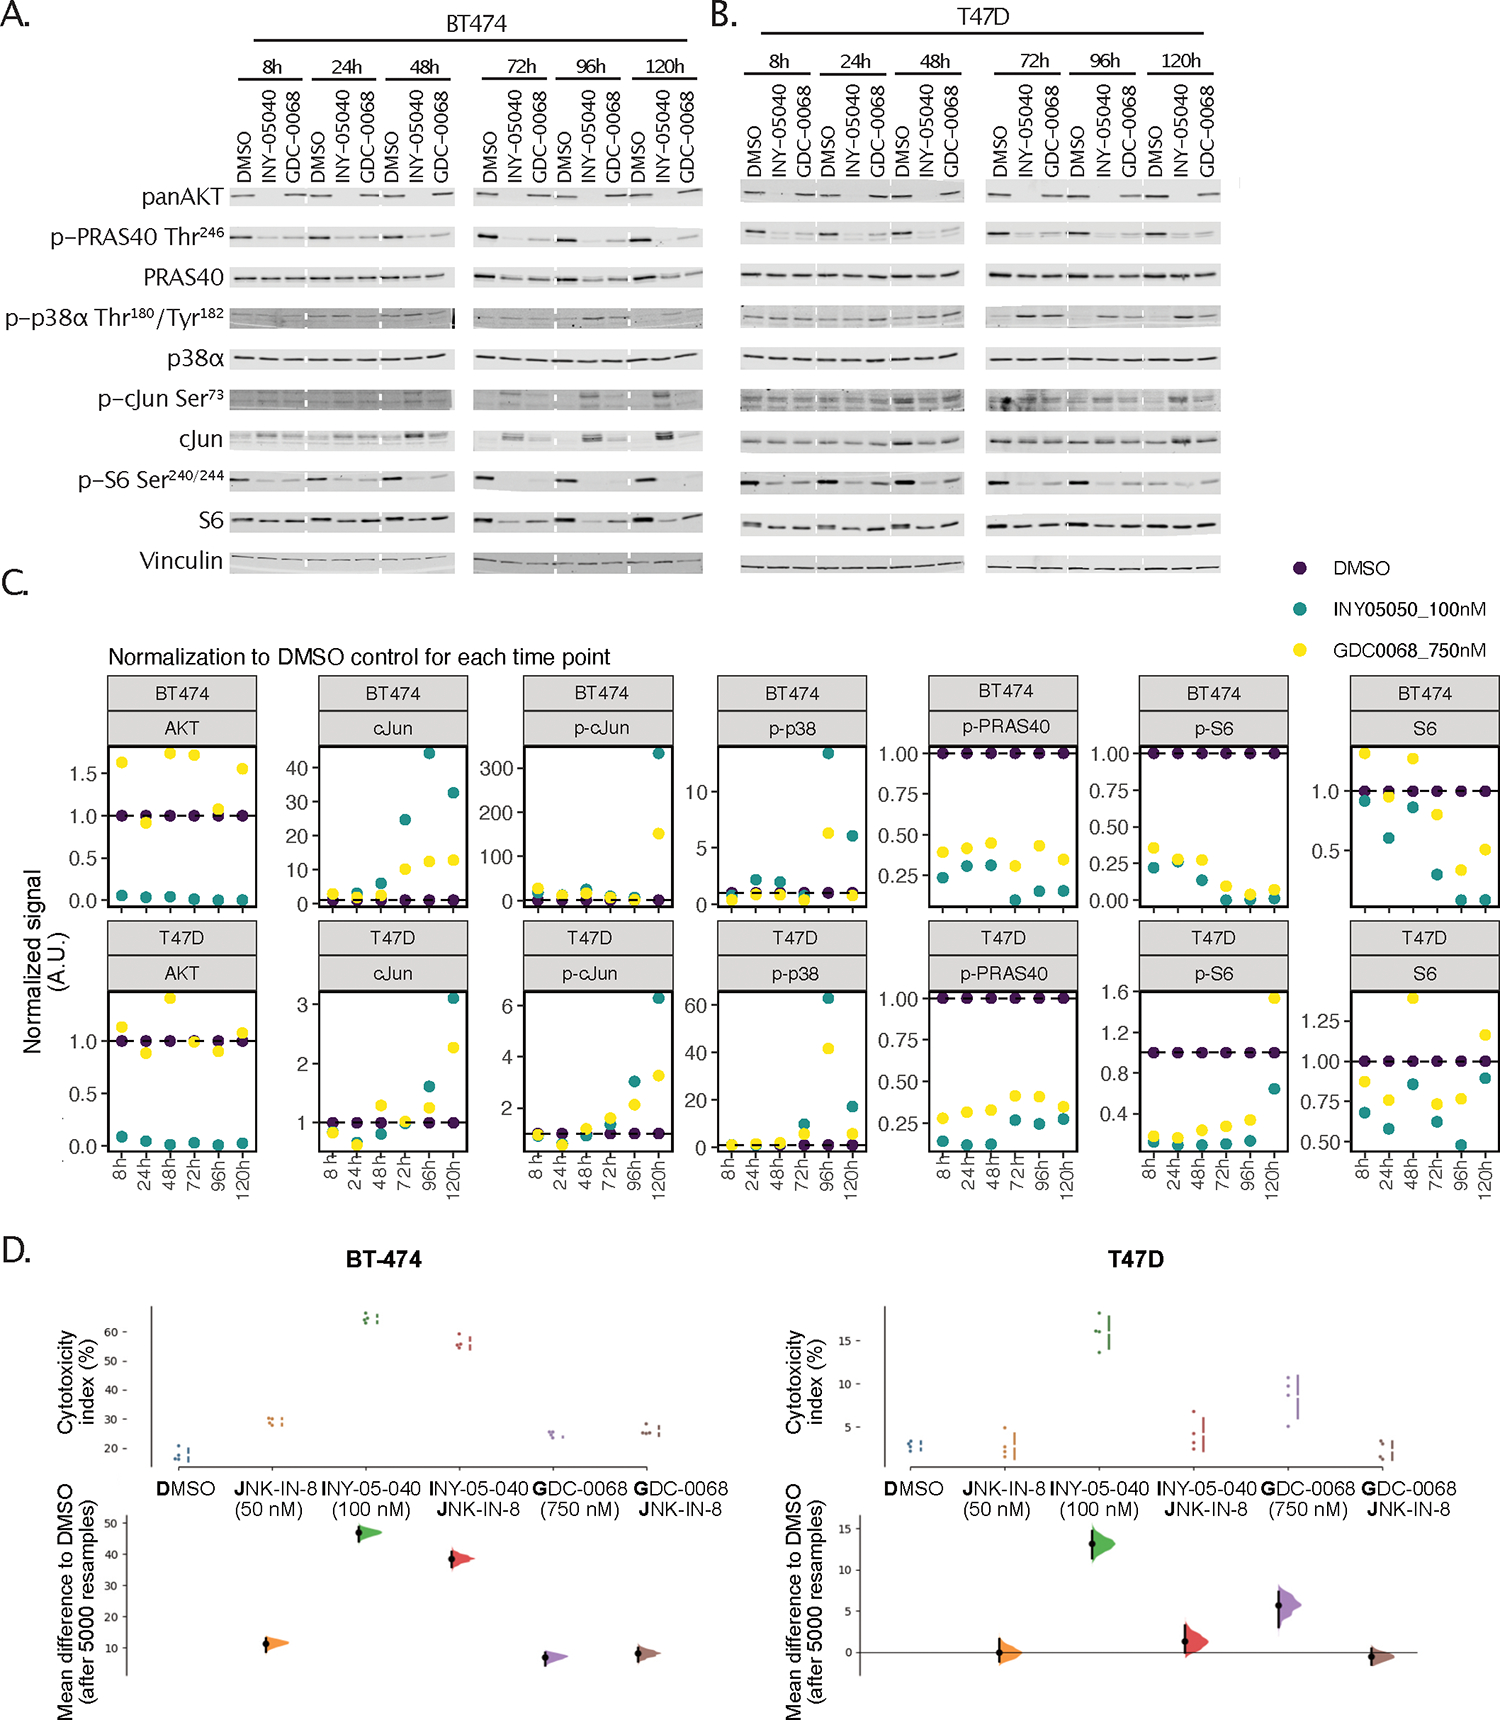
Figure 4. Validation of COSMOS-generated prediction of MAPK stress kinase signaling.

(A and B) Immunoblots for panAKT, phospho-PRAS40 (Thr246), total PRAS40, phospho-p38α (Thr180/Tyr182), total p38α, phospho-c-Jun (Ser73), total c-Jun, phospho-S6 (Ser240/244), total S6, and vinculin after treatment of BT-474 (A) or T47D (B) cells for the indicated times with DMSO, 100 nM INY-05–040, or 750 nM GDC-0068. Data are from a single experiment. (C) Quantification of total AKT (normalized to vinculin), c-Jun (normalized to vinculin), phospho-c-Jun (pJun) Ser73 (normalized to vinculin), phospho-p38 (pP38) Thr180/Tyr182 (normalized to total p38), phospho-PRAS40 (pPRAS40) Thr246 (normalized to total PRAS40), phospho-S6 (pS6) Ser240/244 (normalized to vinculin) and total S6 (normalized to vinculin), including normalization to the respective DMSO control signal for each time point and cell line. Note that phospho-c-Jun and phospho-S6 were normalized to vinculin given changes in the levels of the respective total proteins. Stippled white lines are added to aid interpretation of samples loaded on the same membrane; white blocks separate samples run on different membranes. Supporting data for additional cell lines (MCF7 and MD-MB-468) are included in Fig. S6. (C) Cytotoxicity index assayed using CellTox Green, in BT-474 or T47D cells treated for 24 h with either DMSO or 50 nM JNK-IN-8, followed by 120-h co-treatment with either DMSO, INY-05–040 (100 nM) or GDC-0068 (750 nM). The cytotoxicity index represents cytotoxicity values corrected for background fluorescence and normalized to total signal following chemical permeabilization (used as proxy measure for total cell number). The data are displayed as Cumming plots following bootstrap-coupled estimation of effect size for each condition relative to DMSO. The upper plots display the raw data alongside standard deviations indicated with gapped lines. The plots beneath display the estimated effect sizes, sampling distribution and bootstrap 95% (percentile) confidence intervals. For accurate interpretation, please note differences in y-axis scaling. The data are from a single experiment performed with four technical replicates per condition; data from a separate experimental replicate, including a JNK-IN-8 dose curve, are in Fig. S7.
