Figure 1:

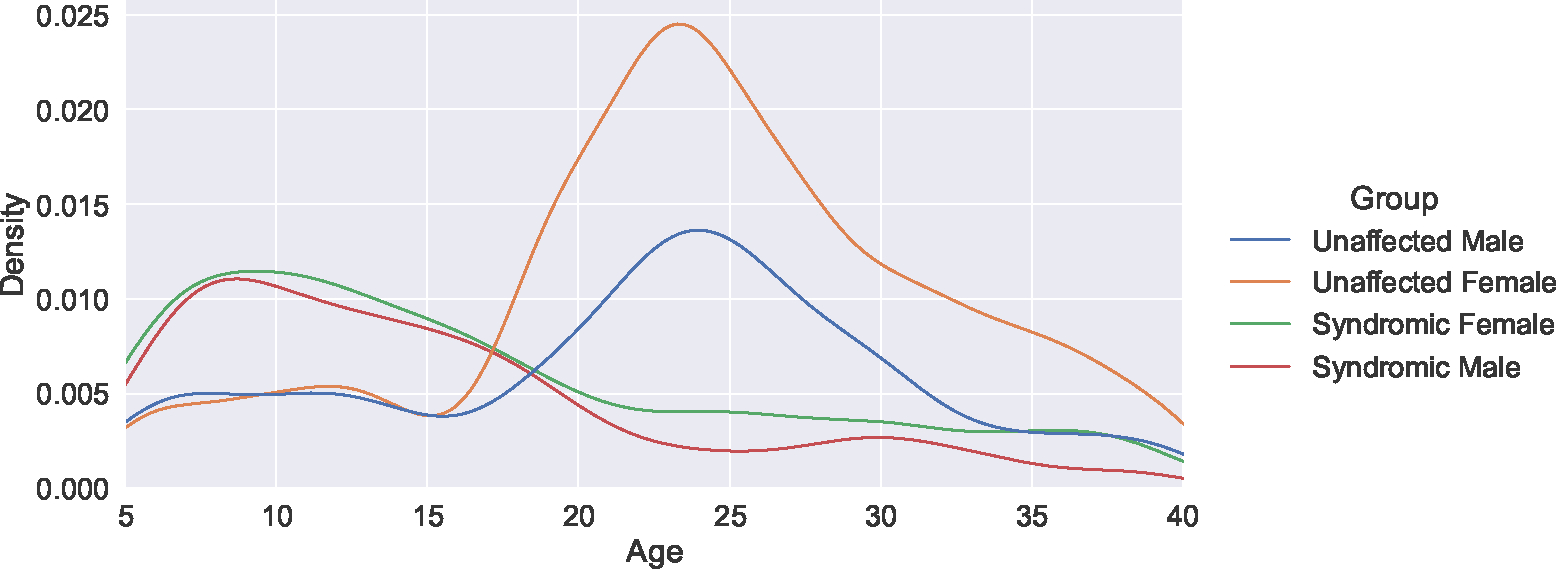
A kernel density plot of the subject demographic distribution. This data set shows a prominent age imbalance between syndromic and unaffected subjects, as well as a sex imbalance among unaffected subjects.

A kernel density plot of the subject demographic distribution. This data set shows a prominent age imbalance between syndromic and unaffected subjects, as well as a sex imbalance among unaffected subjects.