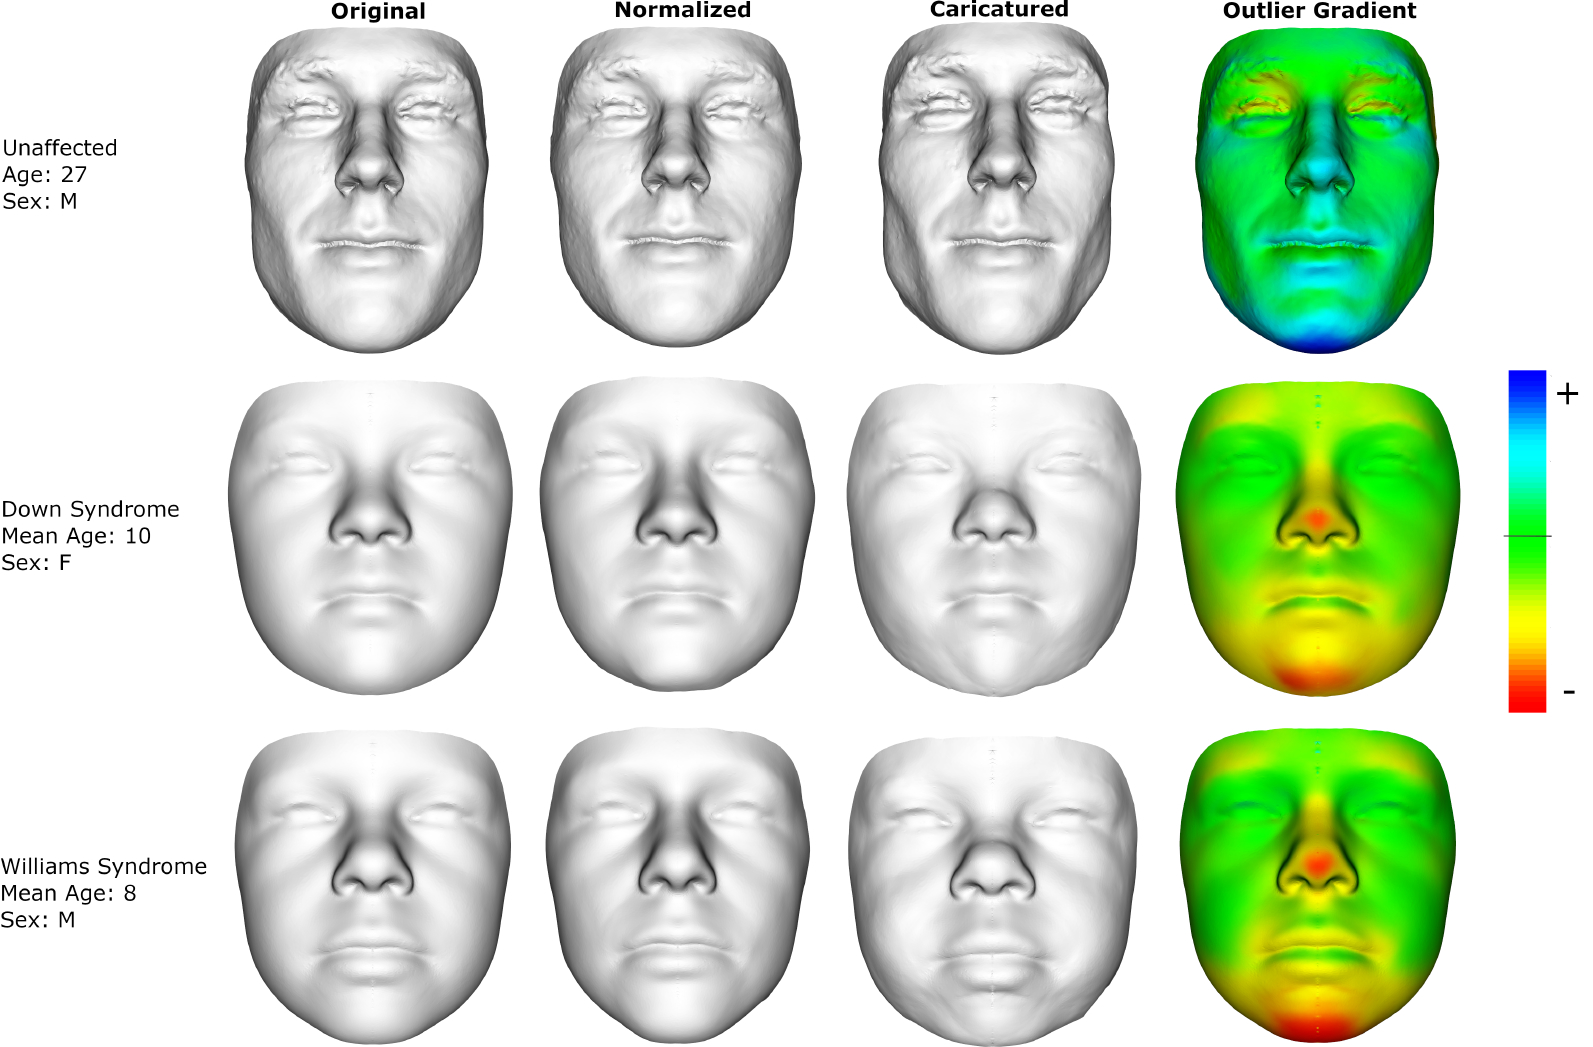
Figure 2:

Faces (original column) that have been transformed along the outlier score gradient to look more normal (normalized) and more unusual (caricatured). The outlier gradient color map shows the surface normal component of the gradient with positive values indicating that the surface is pushed outwards compared to a normalized face and negative values indicating the opposite. The top row is a real example subject. The bottom two rows represent the average faces of Down or Williams syndrome subjects under the age of 15 years.
