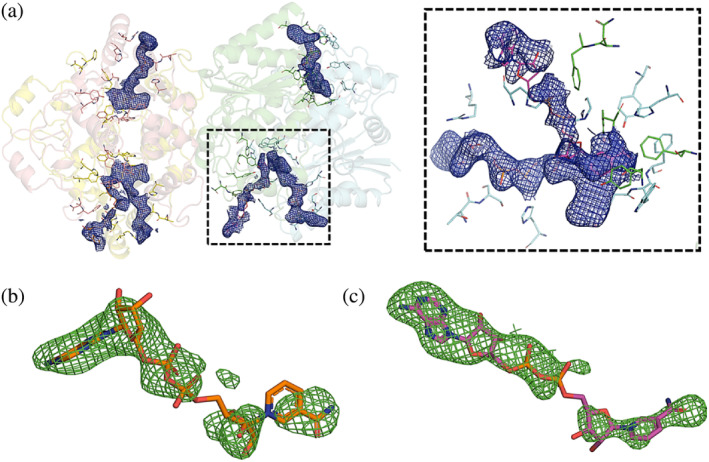
FIGURE 3.

Electron density and OMIT maps of the NQO1‐NAD+/H structure. (a) Cartoon representation of the two homodimers of hNQO1. Electron density maps 2mFo‐DFc contoured at 1 σ of the FAD and NAD+/H molecules are shown as blue meshes. Residues in the catalytic sites are shown as sticks. The right dash boxed panel shows a close‐up view of the catalytic site dash boxed in the left panel. (b) Simulated‐annealing OMIT maps mFo‐DFc contoured at 3σ of the NAD+/H molecule bound to Chain D. (c) Simulated‐annealing OMIT maps mFo‐DFc contoured at 3σ of the NAD+/H molecule bound to Chain B.
