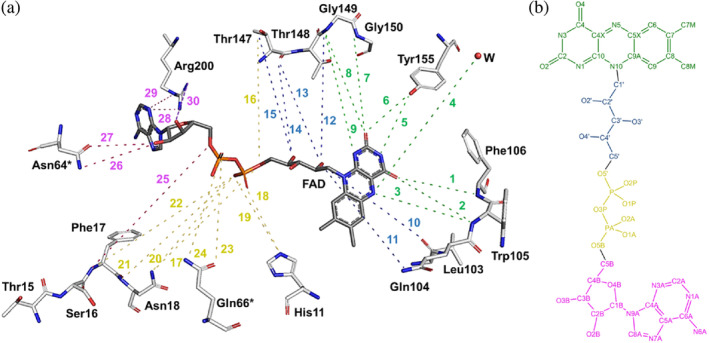
FIGURE 5.

Schematic representation of all hydrogen bond interactions occurring at the FAD binding site. (a) The binding site comprises most of the residues of one protomer and only two residues (Asn64* and Asn66*) of the other protomer. All interactions have been numbered from 1 to 30 (as listed in Table 2) and highlighted using the same color code as in Table 2: Green for all interactions at the isoalloxazine moiety, blue for all interactions at the ribitol moiety, yellow for all interactions at the phosphates moiety, and pink for all interactions at the ribose and adenine moieties. Important to note that, for clarity, all residues, the FAD and the water molecule have been moved and displaced from their original positions in the structure, as well as all the interactions have been exaggerated. (b) Two‐dimensional representation of the chemical structure of the FAD molecule. Atoms have been colored with the same code used for the interactions in (a). All hydrogen bond interactions were evaluated using PYMOL (Schrödinger LLC), which uses the Kabsch and Sander's DSSP secondary structure assignment algorithm (Frishman & Argos, 1995) considering a maximum cut‐off distance of 3.5 Å and a minimum angle of 90° for hydrogen bond formation.
