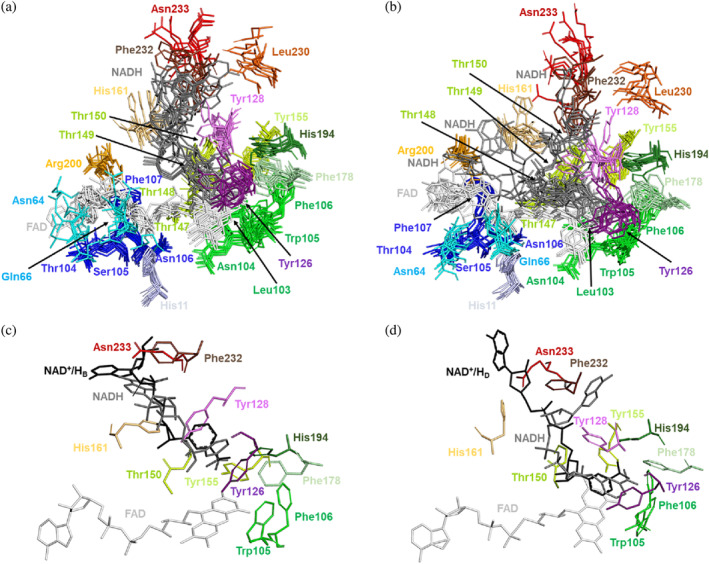
FIGURE 7.

Structural dynamics of the FAD and NADH binding sites in the MD simulations. (a) Superposition of the FAD and NADH binding sites for two randomly picked times from each of the five replicates. All residues comprising the FAD and NADH binding sites of the protomer at the active site labeled as 1 are shown in stick representation. (b) Superposition of the FAD and NADH binding sites for two randomly picked times from each of the five replicates. All residues comprising the FAD and NADH binding sites of the protomer at the active site labeled as 2 are shown in stick representation. (c) Superposition of the NAD+/HB molecule (black sticks) in the hNQO1‐NAD+/H complex to the NADH binding site 1 at 60 ns simulation from replicate 4. (d) Superposition of the NAD+/HD molecule (black sticks) in the hNQO1‐NAD+/H complex to the NADH binding site 1 at 30 ns simulation from replicate 2. All residues in (c) and (d) comprising the NAD+/H binding site are shown as sticks in the same color as that in (a) and (b).
