FIGURE 8.

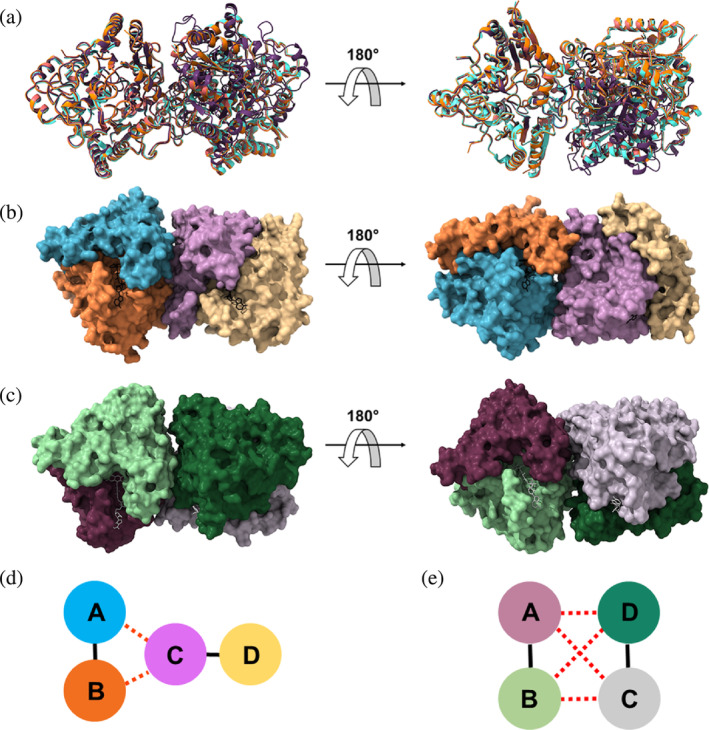
Comparison of the packing in the two homodimers of hNQO1 from different structures. (a) Superposition of the two homodimers in the microcrystals of the free hNQO1 (orange) and hNQO1‐NAD+/H (red), this study, and PDB 8C9J (light blue) (Doppler et al., 2023), to the two homodimers in the large crystals of PDB 8OK0 (purple) (Grieco et al., 2023). (b) Surface representation of the free hNQO1 structure (this study). The FADs are shown as black sticks. (c) Surface representation of the hNQO1 in complex with PMSF (PDB 8OK0) (Grieco et al., 2023). The FADs are shown as gray sticks. d) Schematic diagram of the intra‐homodimer (solid black lines) and inter‐homodimer (dashed red lines) interactions established in the microcrystals. As shown in (a), the two homodimers are stabilized through interactions between Chains A and B of one of the homodimers and Chain C of the other homodimer with no participation of monomer D (yellow). (e) Schematic diagram of the intra‐homodimer (solid black lines) and inter‐homodimer (dashed red lines) interactions established in the large crystals. As shown in (b), the two homodimers are stabilized through interactions between Chains A and B of one of the homodimers and Chains C and D of the other homodimer.
