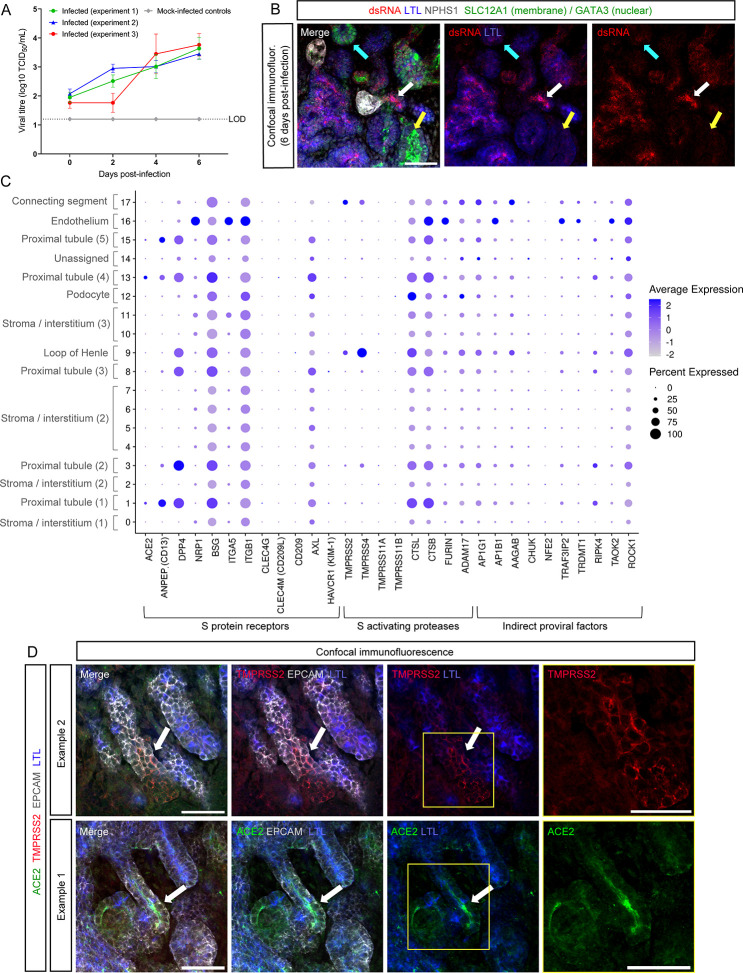
Fig 1.
PT-enhanced organoids show extensive viral entry factor expression. (A) Line plot depicting viral titre as determined by Vero cell assays (Median Tissue Culture Infectious Dose; log10 TCID50) of culture media sampled from WA1 SARS-CoV-2 (icSARS-CoV-2-GFP)-infected PT-enhanced organoids across three independent experiments replicated identically (red, green, and blue lines), as well as mock-infected organoids (gray line). Mock-infected line is representative of all mock results across each experiment. LOD and dotted line represent lower limit of detection. Error bars represent standard error of the mean (SEM) from n = 3 individual wells of organoids (three organoids per well) at each timepoint (note these data represent the “no drug controls” from experiments depicted in Fig. 3A). (B) Confocal immunofluorescence of a representative PT-enhanced organoid 6 days post-infection, demonstrating SARS-CoV-2 double stranded RNA (dsRNA; red) localization, co-stained for markers of proximal tubules (LTL; blue), loop of Henle (SLC12A1; green, apical membrane staining), late distal tubule/connecting segment (GATA3; green, apical), and podocytes of the glomeruli (NPHS1; gray). Arrows indicate examples of a LTL-positive tubule (white arrow), SLC12A1-positive tubule (yellow arrow), and GATA3-positive tubule (cyan arrow). Scale bar represents 50 µm. (C) scRNAseq DotPlot of PT-enhanced organoids (day 14 of organoid culture) depicting the expression of entry factors (receptors and proteases) and pro-viral factors reported in literature to be involved in SARS-CoV-2 infectivity. Identities of each cluster are labeled (left axis), with numbers in brackets differentiating kidney cell populations for which multiple clusters exist. (D) Confocal immunofluorescence of PT-enhanced organoid examples depicting ACE2 expression (green) within LTL + proximal tubules (blue) and TMPRSS2 (red) in LTL structures. Epithelium is marked with EPCAM (gray). Arrows depict examples of ACE2 and TMPRSS2 staining. Yellow squares highlight fields of view shown at higher magnification in the images on far right. Scale bars represent 50 µm.

