Fig 3.
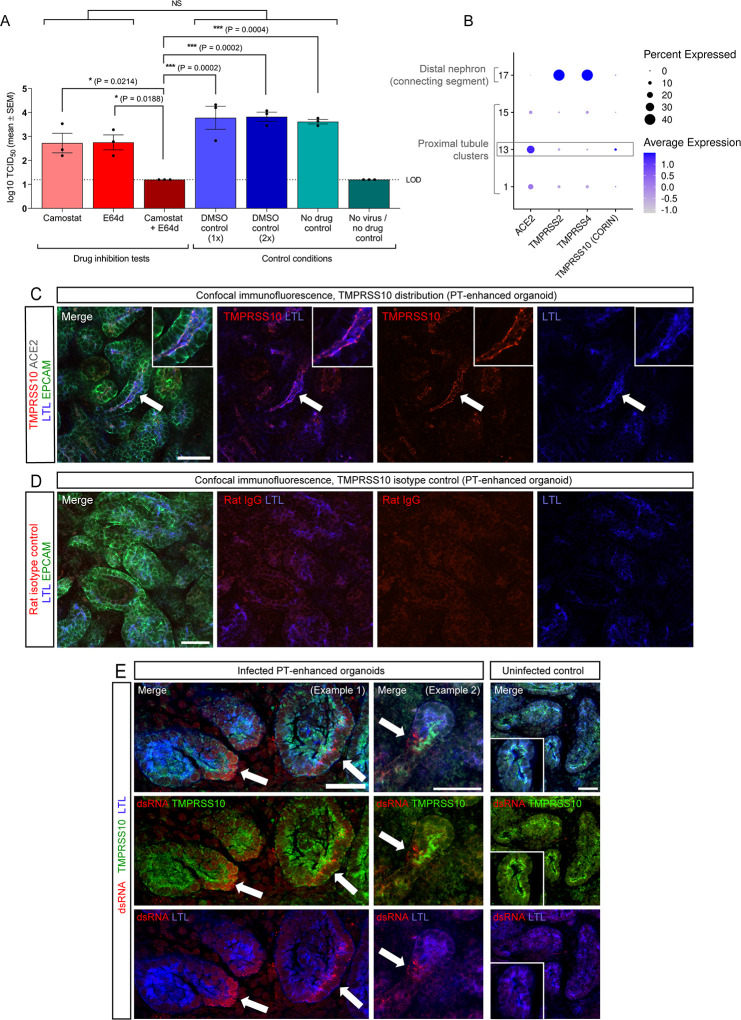
Drug inhibition assays revealing dual viral entry pathway usage by SARS-CoV-2. (A) Bar graph depicting the viral titres (log10 TCID50/mL) of culture media sampled from PT-enhanced organoids 6 days post-infection, treated with either protease inhibitors (Camostat and E64d, alone or in combination; dark/light red bars), drug reconstitution reagent (DMSO controls; dark/light blue bars), or remaining untreated (no drug controls; light/dark green bars). PT-enhanced organoids were infected with WA1 SARS-CoV-2. (icSARS-CoV-2-GFP). LOD and dotted line represent lower limit of detection. Error bars represent SEM from three independent experiment, with three (drug inhibition tests and no drug controls) or two (DMSO controls) biological replicates per timepoint. Significance was calculated using a one-way ANOVA with Tukey’s multiple comparisons test. Asterisks represent two-tailed P values (*P ≤ 0.05, **P ≤ 0.01, ***P ≤ 0.001, ****P ≤ 0.0001). NS, not significant. (B) scRNAseq DotPlot of PT-enhanced organoids (day 14 of organoid culture) depicting the expression of TMPRSS genes within the highest ACE2-expressing proximal tubule clusters and distal (connecting segment) nephron cluster. The proximal tubule cluster most enriched with ACE2 expression is outlined in gray. Dot size represents the percentage of cells expressing a gene within each cluster, while shade intensity correlates with gene expression level. (C and D) Confocal immunofluorescence of TMPRSS10 (C, red) and corresponding rat isotype control (D, red), co-stained with markers of proximal tubule (LTL, blue) and nephron epithelium (EPCAM, green). Arrows indicate region shown at higher magnification in inset images. Scale bars represent 50 µm. (E) Confocal immunofluorescence of SARS-CoV-2-infected and uninfected (control) PT-enhanced organoids, depicting virus (dsRNA, red) within TMPRSS10-expressing (green) proximal tubules (marked with LTL, blue) within infected samples and lack of dsRNA detection in uninfected control. Arrows depict examples of dsRNA staining. Scale bars represent 50 µm.

