Fig 4.
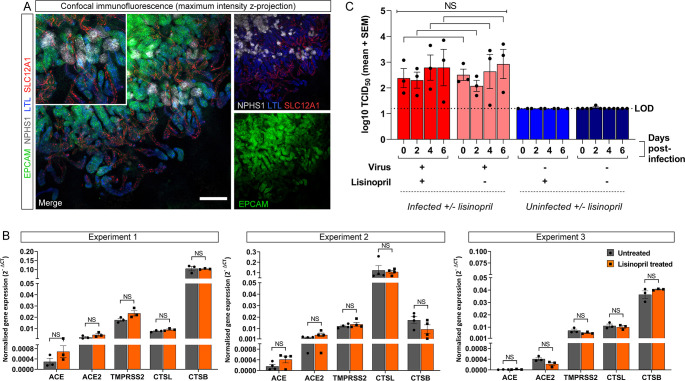
PT-enhanced organoids do not show increased susceptibility to SARS-CoV-2 infection following lisinopril exposure. (A) Confocal immunofluorescence of a representative PT-enhanced organoid following 8 days of lisinopril treatment, depicting nephron epithelium (EPCAM; green), podocytes of the glomeruli (NPHS1; gray), proximal tubules (LTL; blue), and loop of Henle (SLC12A1; red). Inset depicts a region of the same merge image shown at higher magnification. Scale bar represents 200 µm. (B) qRT-PCR analyses of untreated (gray bars) and lisinopril-treated (orange bars) PT-enhanced organoids (14 days of organoid culture) from three independent experiments for expression of the lisinopril target, ACE, and relevant SARS-CoV-2 entry factors. Error bars represent SEM from three biological replicates. Statistical significance was assessed using an unpaired t test. NS, not significant. (C) Bar graph depicting the viral titres (log10 TCID50/mL) of culture media sampled from untreated and lisinopril-treated PT-enhanced organoids, either infected with WA1 SARS-CoV-2 (icSARS-CoV-2-GFP) 48 h post-treatment (light/dark red bars) or remaining uninfected (light/dark blue bars). LOD and dotted line represent lower limit of detection. Significance was assessed using unpaired t tests adjusted for multiple comparisons using the Holm-Sidak method. NS, not significant.

