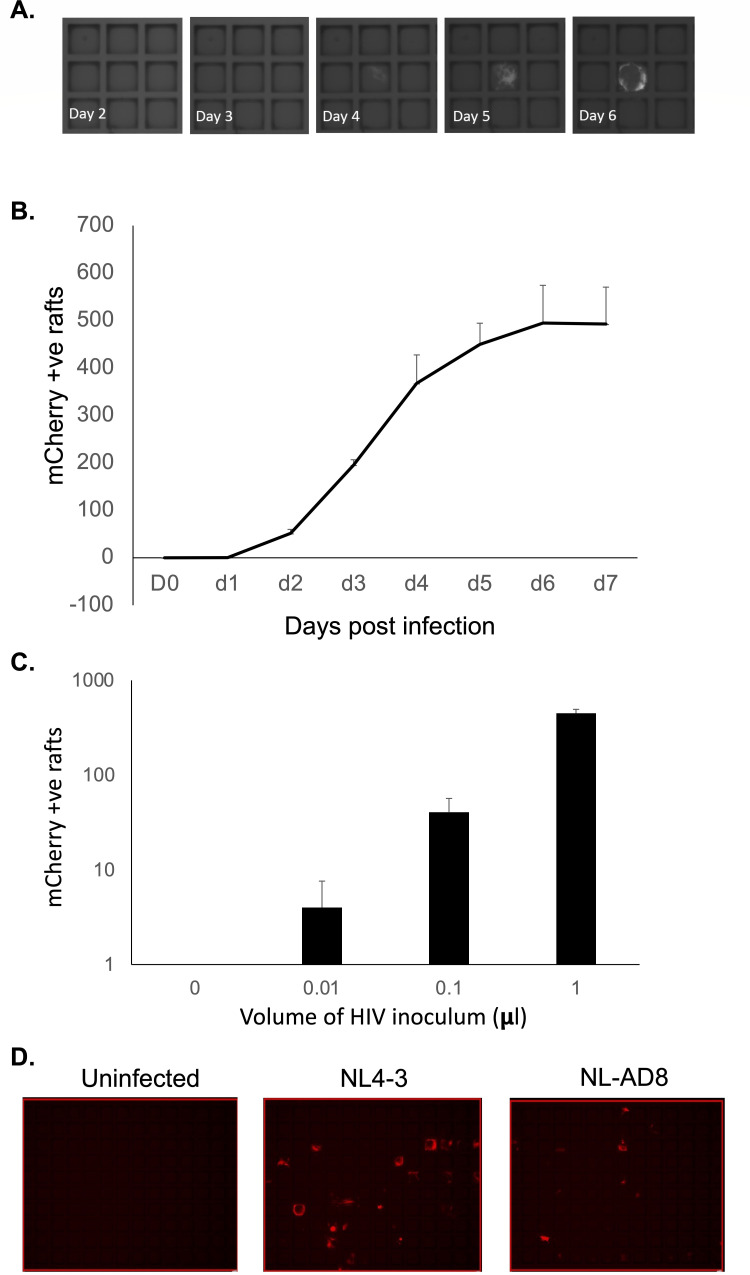
Fig 3.
Detection of HIV infection in CellRaft arrays. MOA cells were plated in a CellRaft array, then infected with HIV (NL4-3), or mock infected. (A) Representative images collected over time showing an individual positive raft. (B) mCherry-positive rafts were counted by scanning each day after infection of the arrays. The average number of positive rafts per array from three arrays is shown. Error bars represent standard deviation of the mean. (C) At day 5 post infection, the number of mCherry-positive rafts was determined for each volume of viral inoculum. The average number of positive rafts per array from three arrays is shown. Error bars represent standard deviation of the mean. (D) MOA cells were plated in CellRaft arrays; then, 1 µL viral inoculum from two different strains of HIV with different co-receptor tropisms (NL4-3, CXCR4 tropic and NL-AD8, CCR5 tropic) corresponding to approximately ~1,000 infectious units was added to the arrays. At 5 days post infection (dpi), the array was scanned for mCherry expression. Representative images are shown.

