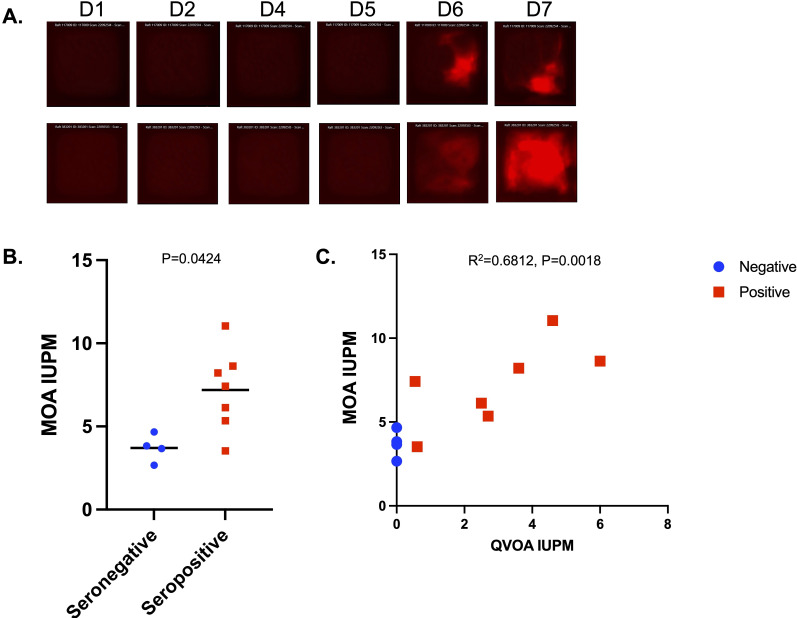
Fig 9.
Detection of HIV-infected cells in PWH on ART. Resting CD4 T cells from seven PWH on ART and four serogenative controls were activated for 48 hours with PHA/IL-2, then washed, and co-plated in hexaquad CellRaft arrays at 50 T cells per raft with MOA cells (4 cells per raft) in the presence of 10 nM Dasatinib. Arrays were scanned daily for 7 days of co-culture. (A) Examples of two rafts with evidence of viral transmission are shown. (B) Comparison of MOA IUPM values for seronegative (blue) and HIV-seropositive donors (red). P value calculated by Mann-Whitney U test. (C) Quantification of total mCherry+ rafts for each donor over the timecourse calculated as IUPM and compared with known QVOA IUPM values for the same donors. Pearson correlation r2 and statistical significance are shown. Serostatus for HIV indicated by color—blue for seronegative and red for seropositive.

