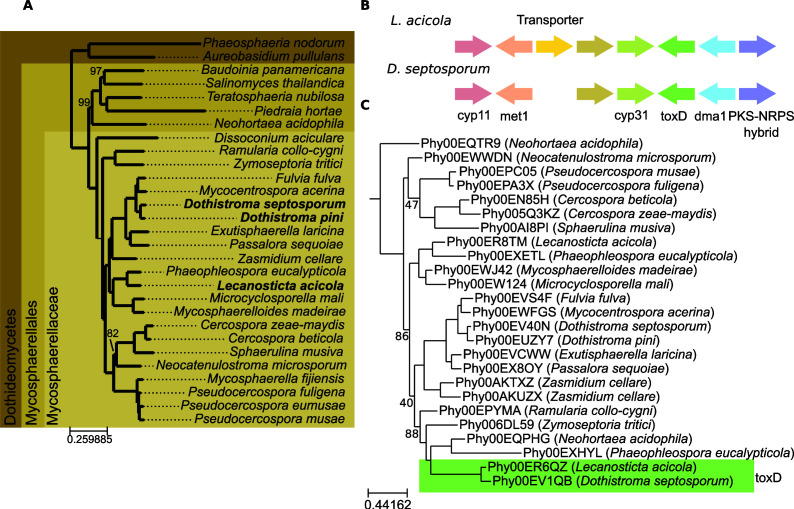
Fig 1.
(A)- Phylogenetic tree representing the evolutionary relationships among the species included in the phylome. The tree is based on a maximum likelihood analysis of a concatenated alignment of 1,092 genes (see Methods), trimmed to delete columns with more than 20% gaps. The phylogenetic tree was reconstructed using IQTREE using the LG + F + R8 model according to the BIC criterion. Rapid bootstrap was calculated and nodes with less than 100% support are indicated. Species indicated in bold are pathogens of pine trees. (B)- Representation of the gene cluster found shared between L. acicola and D. septosporum. (C)- Gene tree representing the evolution of ToxD as obtained from the phylome reconstruction. Bootstrap values below 90 are marked on the tree.

