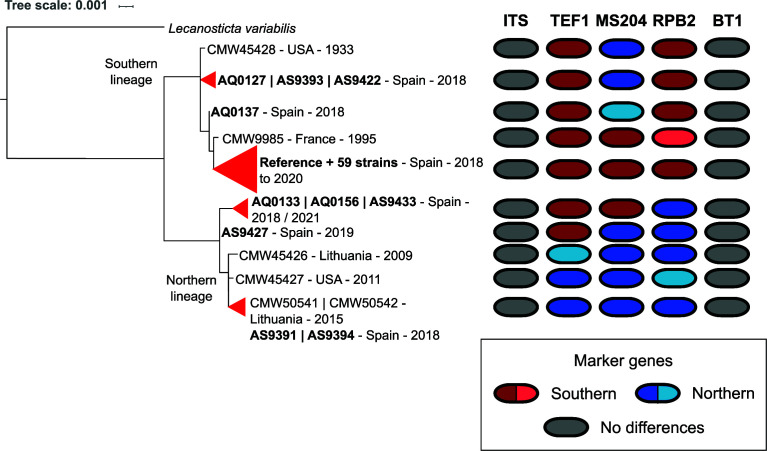
Fig 2.
Phylogenetic tree based on the concatenation of marker genes. Strains sharing identical marker sequences were collapsed (indicated by triangles). In bold are strains sequenced in this study. On the right of the tree marker sequences are represented: each column represents a marker gene. Different marker haplotypes of the NL or SL are shown in shades of blue and red, respectively. Different shades of blue or red indicate strains that share the same pattern of SNPs for a given marker gene. Invariable markers are depicted in gray.

