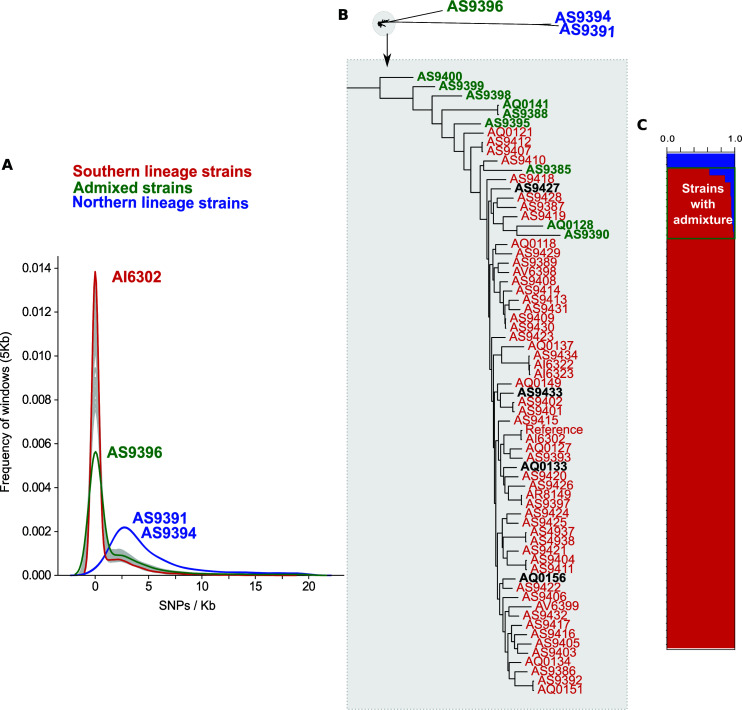
Fig 3.
(A)- Frequency graph depicting the distribution of SNPs/Kb for each strain for windows of 5 Kb of the contigs longer than 100,000 base pairs. Green is the distribution belonging to the strain with an overall SNPs/Kb of 5. Blue is the distribution of the two NL strains. Red is an example of a SL strain (B)- On top is an unrooted tree showing the evolution of the 70 strains used in this study. Below it is a close-up image from the part of the phylogenetic tree holding strains belonging to the SL. Red are the strains considered purely from the SL. Green are the strains detected as admixed by Structure. Black are the strains that would have been classified as being from the NL based on marker genes. (C) Structure graph showing the two populations in blue and red. The green square indicates admixed isolates.

