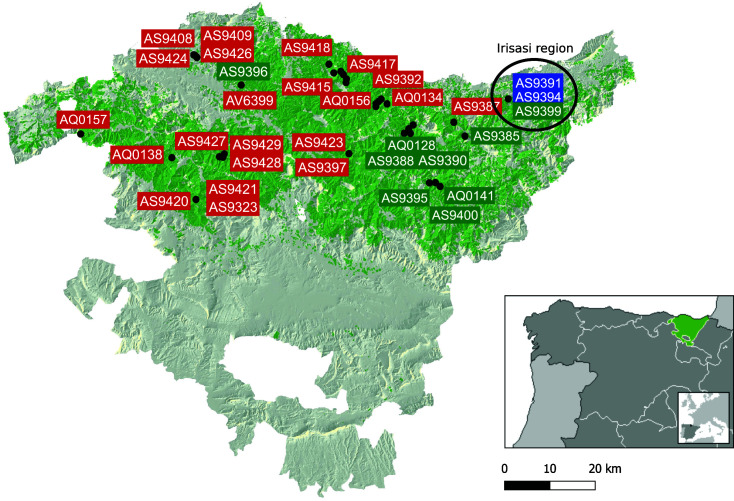
Fig 6.
Geographic distribution of sampling sites for some of the strains used in this study. Blue, red, and green rectangles mark isolation sites for NL, SL, or introgressed (according to Structure) strains, respectively. The background area covered in green tones corresponds to the area of distribution of Pinus radiata arboretum in the Basque Country.

