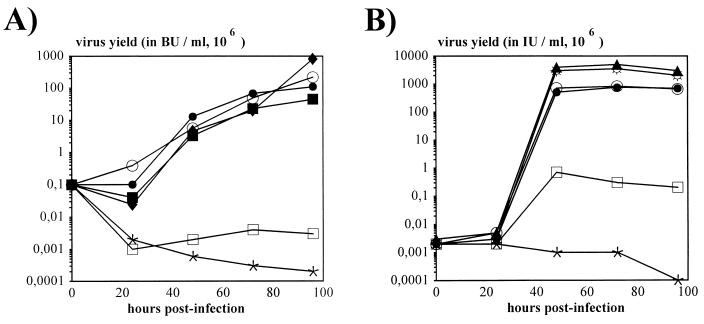
FIG. 2.
Kinetics of viral growth. (A) Kinetics of AdE1° and AdE1°E2A° virus propagation in 293 and 293-E2A cells. Cells were infected at an MOI of 0.2 BU/cell. Titration of infectious viral progeny (in BU) at the indicated times p.i. was performed on 293-E2A cells. AdE1° (AdTG4656) (⧫, ○, and •) was used to infect 293 cells (⧫) and 293-E2A-9-72 cells in the presence (•) and absence (○) of dexamethasone induction. Similarly, AdE1°E2A° (AdTG9542) (▪, □, and ∗) was used to infect 293 cells (∗) and 293-E2A-9-72 cells in the presence (▪) and absence (□) of dexamethasone induction. (B) Kinetics of AdE1° and AdE1°E4° virus propagation in 293, 293-E4 (clone 293/1653il), and 293-E4ORF6+7 (clone 293/5-19) cells. Cells were infected at an MOI of 0.05 IU/cell. Titration of infectious viral progeny (in IU) at the indicated times p.i. was performed on 293 cells. AdE1° (AdTG4656) (⧫ and ☼) was used to infect 293 cells (⧫) and 239-E4ORF6+7 cells (☼); similarly, AdE1°E4° (AdTG8595 [•, □, and ∗] or AdTG5643 [○]) was used to infect 239-E4ORF6+7 (• and ○), 293-E4 (□), and 293 (∗) cells.

