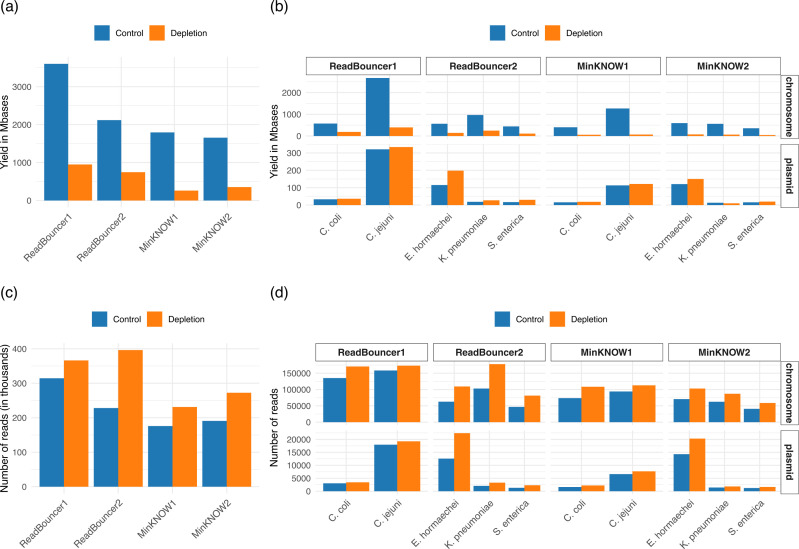
Fig 1.
Comparison of flow cell yield in terms of sequenced base pairs and reads after 24 hours. (a) Yield in megabases for each flow cell separated by control and adaptive sampling region (depletion). (b) Yield in megabases for each flow cell region separated by plasmid and chromosome. (c) Number of sequenced reads for each flow cell separated by control and adaptive sampling region (depletion). (d) Number of sequenced reads for each flow cell region separated by plasmid and chromosome.

