Figure 7.

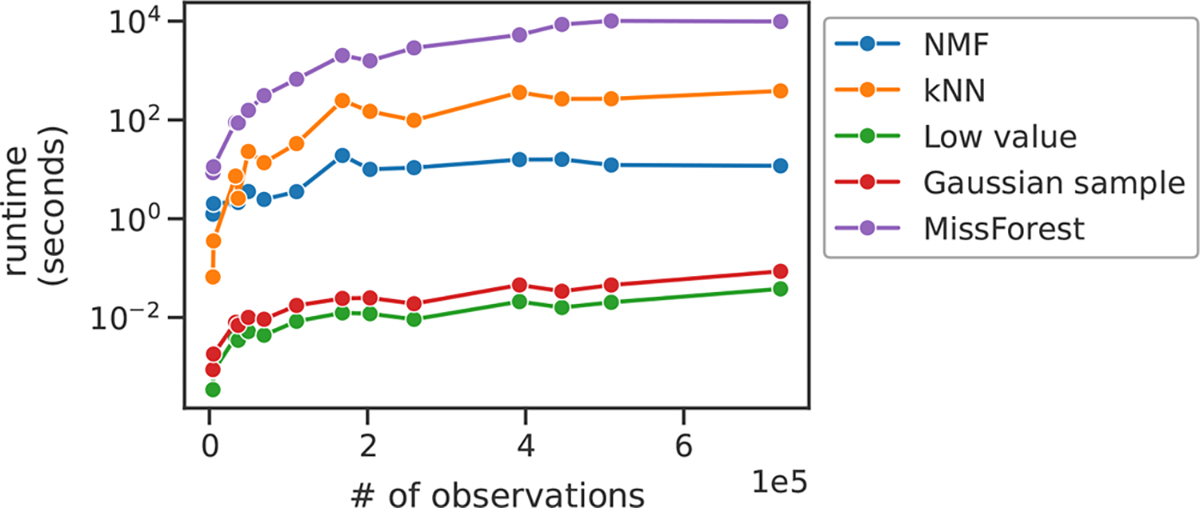
Runtime comparison for the imputation methods. Each point represents a data set. Data sets are ordered by the number of nonmissing observations in their training sets after an 80%/20% MCAR train/test partition.

Runtime comparison for the imputation methods. Each point represents a data set. Data sets are ordered by the number of nonmissing observations in their training sets after an 80%/20% MCAR train/test partition.