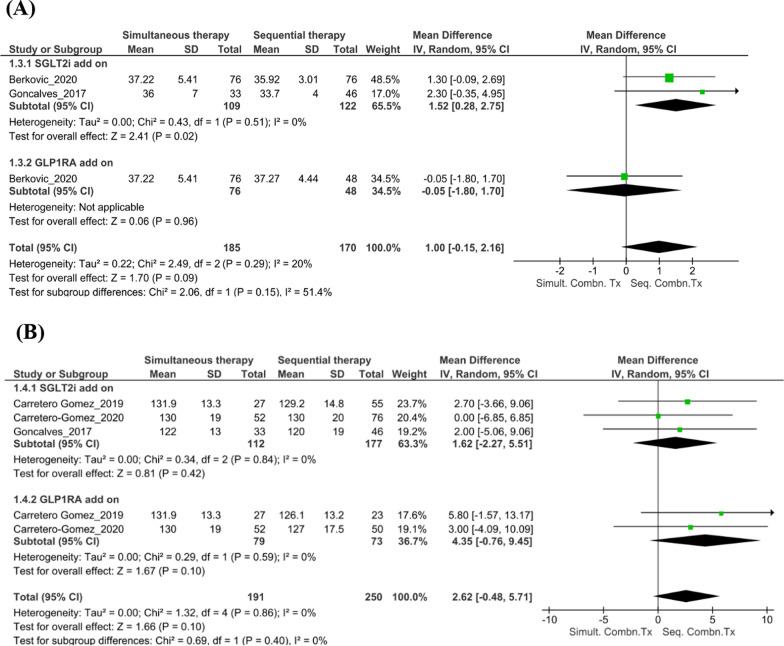
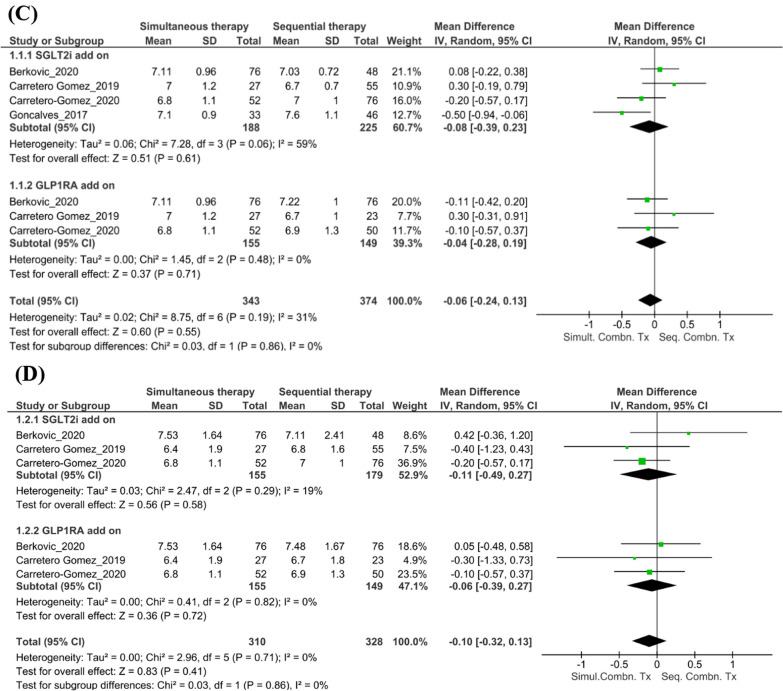
Fig. 4.
Findings from the subgroup analyses. A Changes in BMI with simultaneous versus sequential combination therapy at the 6-month follow-up. B Changes in SBP with simultaneous versus sequential combination therapy at the 6-month follow-up. C Changes in HbA1c levels with simultaneous versus sequential combination therapy at the 6-month follow-up. D Changes in FPG levels with simultaneous versus sequential combination therapy at the 6-month follow-up. BMI body mass index, CI confidence interval, FPG fasting plasma glucose, GLP-1RA glucagon-like peptide-1 receptor agonist, HbA1c glycated hemoglobin, IV importance value, SBP systolic blood pressure, SD standard deviation, SGLT2i sodium–glucose transport protein 2 inhibitor, Seq. Combn. Tx sequential combination therapy, Simult. Combn. Tx simultaneous combination therapy


