Fig. 1.
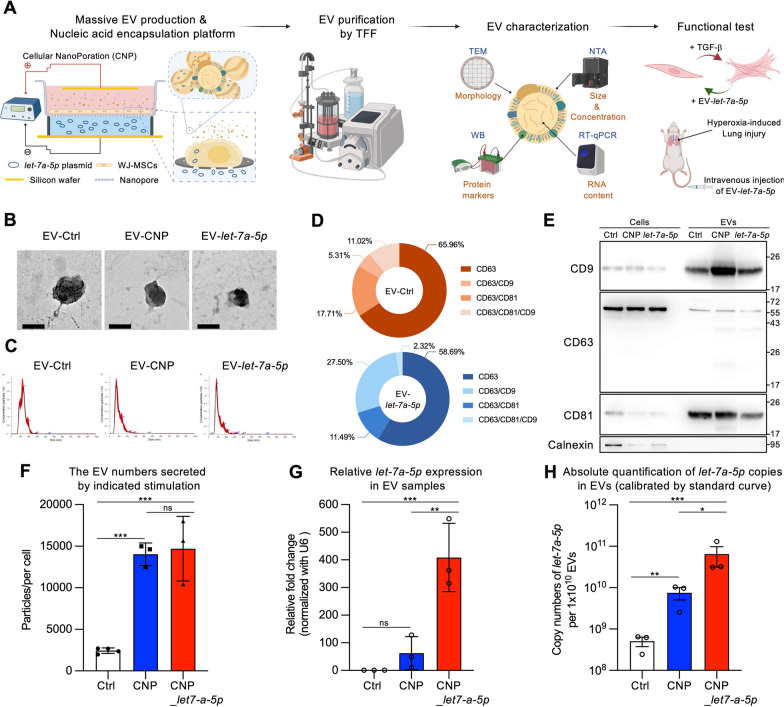
Production and characterization of engineered EVs. A Schematic flowchart illustrating the engineered EV production and characterization. Donor cells on the track-etched membrane are transfected with plasmid DNA from below the insert through high-electric field strength in pores. CNP improves the release of EVs carrying therapeutic RNA cargoes transcribed from plasmids. The supernatant containing EVs was then purified by the TFF method. TEM, WB, NTA, and RT-qPCR were used to investigate the EV characterization before all functional tests and in vivo experiments. The illustration was created with BioRender.com. B TEM images displayed the morphology of EVs. Scale bar = 100 nm. C Measurement of three groups of EVs using NTA. D Representative pie charts obtained from the ExoView chip illustrated the co-localized percentage of total particles detected with various CD markers, including CD63, CD63/CD9, CD63/CD81, or CD63/CD81/CD9. These charts correspond to different capture spots/EVs. E Western blot analysis of exosomal CD markers in total cell lysate or EVs, with Calnexin as the negative control for EVs. F Quantification of particle numbers secreted by donor cells with the indicated stimulation. The MSCs processed by the CNP platform significantly improved the EV production rate per cell compared to non-electroporated cells. G Detection of the relative expression of let-7a-5p using RT-qPCR. H Absolute quantification of let-7a-5p copies using standard curve calibration. For B–H, the images are representative of n = 3 biologically independent experiments. Data were presented as mean ± standard error of the mean. For F–H, the data were analyzed by two-tailed unpaired Student’s t-test. (*p < 0.05, **p < 0.01, ***p < 0.001, ns = non-significant)

