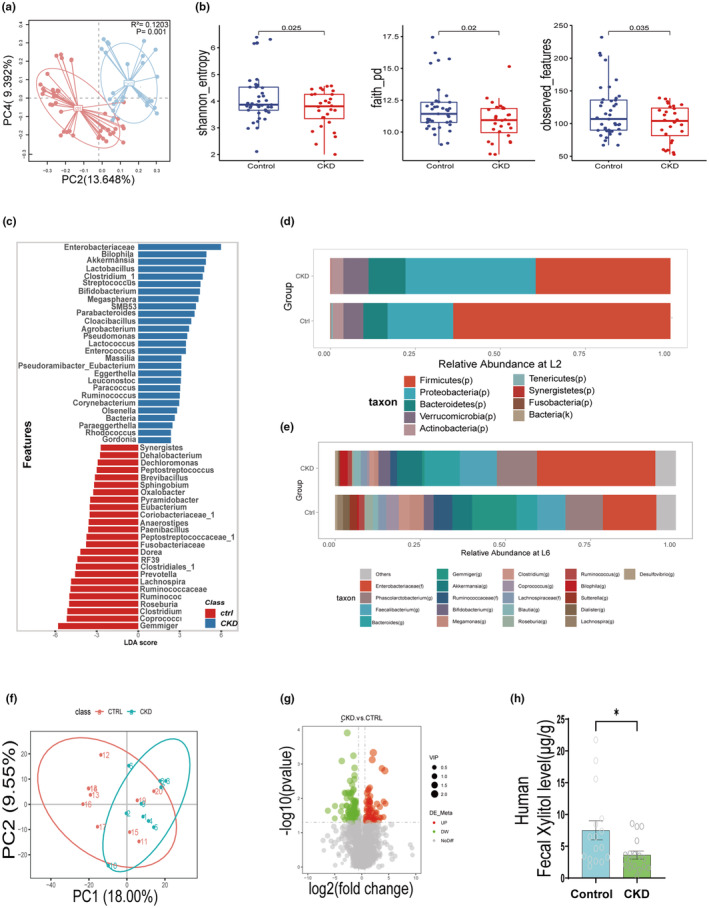
FIGURE 2.

Changes in the intestinal microenvironment in patients with CKD. (a) PCoA of intestinal flora in patients with CKD (n = 28) with healthy adults (control, n = 41). (b) Comparison of intestinal flora abundance in patients with CKD (n = 28) with healthy adults (n = 41). (c) Graph of intestinal flora LEfse analysis in patients with CKD (n = 28) with healthy adults (n = 41). (d, e) Comparison of relative abundance of intestinal flora at L2 and L6 in patients with CKD (n = 28) with healthy adults (n = 41). (f) PCoA of intestinal bacterial metabolites in patients with CKD (n = 10) versus healthy adults (n = 10). (g) Volcano plot of intestinal flora metabolites in patients with CKD (n = 10) versus healthy adults (n = 10). (h) HPLC determination of xylitol content in the intestines of patients with CKD (n = 17) versus healthy adults (n = 16). Data are presented as mean ± SEM. *p < 0.05. CKD, chronic kidney disease; HPLC, high‐performance liquid chromatography; LDA, linear discriminant analysis; LEfSe, linear discriminant analysis effect size; PCoA, principal component analysis.
