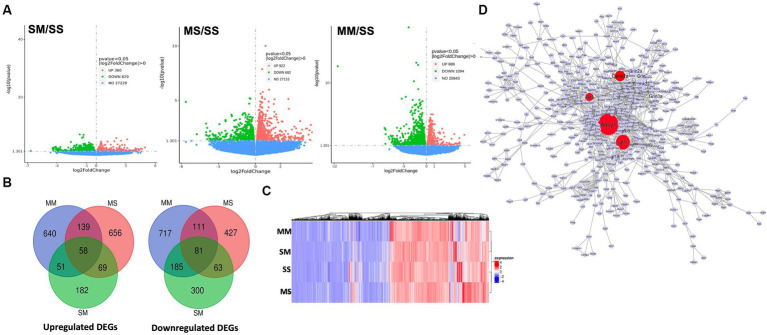
Figure 3.
RNA sequencing of differentially expressed genes in the prefrontal cortex. (A) Volcano plot showing the numbers of upregulated and downregulated differentially expressed genes in SM, MS, and MM groups in comparison to control (SS). (B) Overlap between differentially upregulated and downregulated genes in each group. (C) Heatmaps showing clusters of differentially expressed genes in different groups. (D) Protein interaction network showing ADCY1, Akt3, and CAMk2a (in red) are hubs and highly differentially expressed during methamphetamine treatment.

