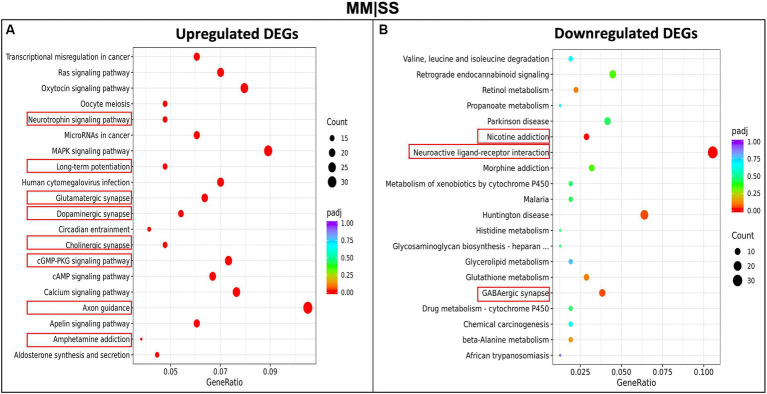
Figure 4.
KEGG-pathway analysis of differentially expressed genes (DEGs). (A) Enriched pathways in upregulated genes between MM in comparison to control (SS). (B) Enriched pathways in the downregulated MM genes in comparison to control (SS). The red rectangular boxes are the significantly enriched neurological pathways or processes.

