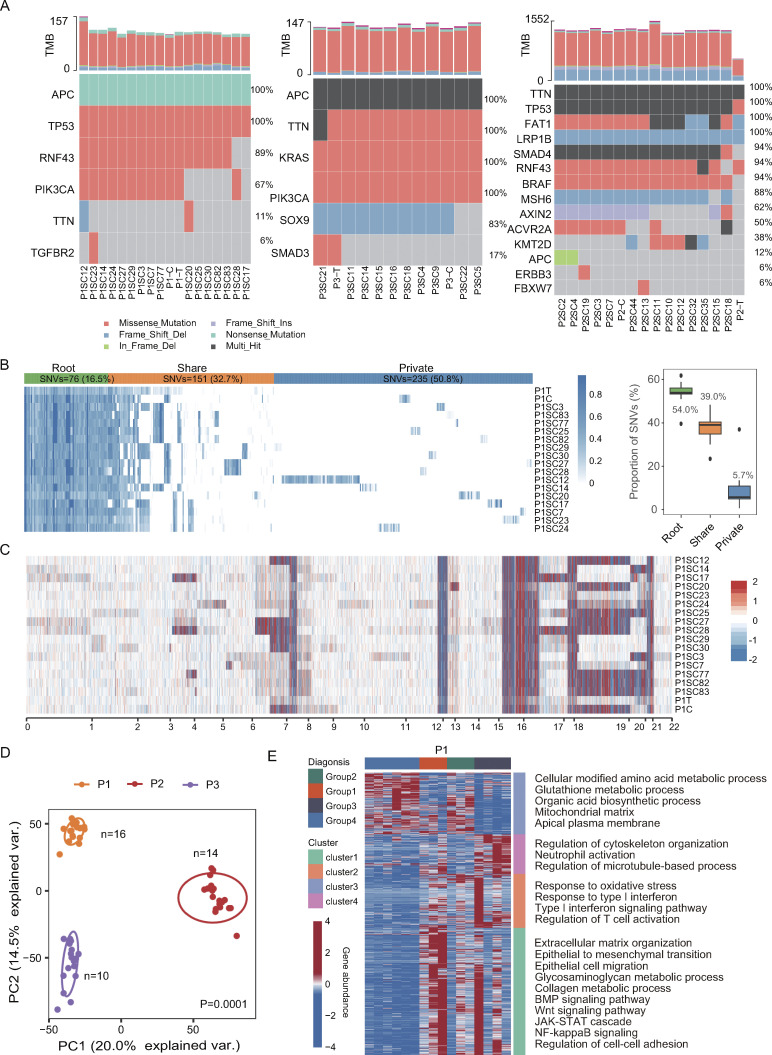
Figure 1.
Establishment of SC-PDCCs with molecular heterogeneity. (A) Somatic mutations related to CRC were detected in all samples from P1, P2, and P3. C, pooled PDCCs; T, parental tumor; P1SC12, SC-PDCC lines #12 from P1, and so on. n = 46. (B) In the left panel, a heatmap illustrating the allele frequency of SNVs in the parental tumor, pooled PDCCs, and 16 SC-PDCC lines of P1. Variations are classified as root (present in all samples), share (present in multiple samples but not all), and private (present in specific samples). In the right panel, the boxplot shows the distribution of each SNV type among samples, and the labeled numbers indicate the median proportion of mutations. n = 18. (C) Heatmap shows CNAs in parental tumor, pooled PDCCs, and different SC-PDCC lines of P1. Red denotes copy number gains, and blue denotes copy number loss. n = 18. (D) PCA plot of transcriptome variation of SC-PDCC lines within the individual tumors. Different SC-PDCC lines in each patient are dispersed. Significance was determined by PERMANOVA test, P = 0.0001. P1, n = 16; P2, n = 14; P3, n = 10. (E) GOEA of consensus clustered genes. Each column represents a SC-PDCC sample of P1, and samples were grouped based on the top 1,000 highly variable genes. Rows represent DEGs (Padj < 0.05 and |log2fold-change| > 0.5), which was the result of comparing each sample group with other samples. n = 16.

