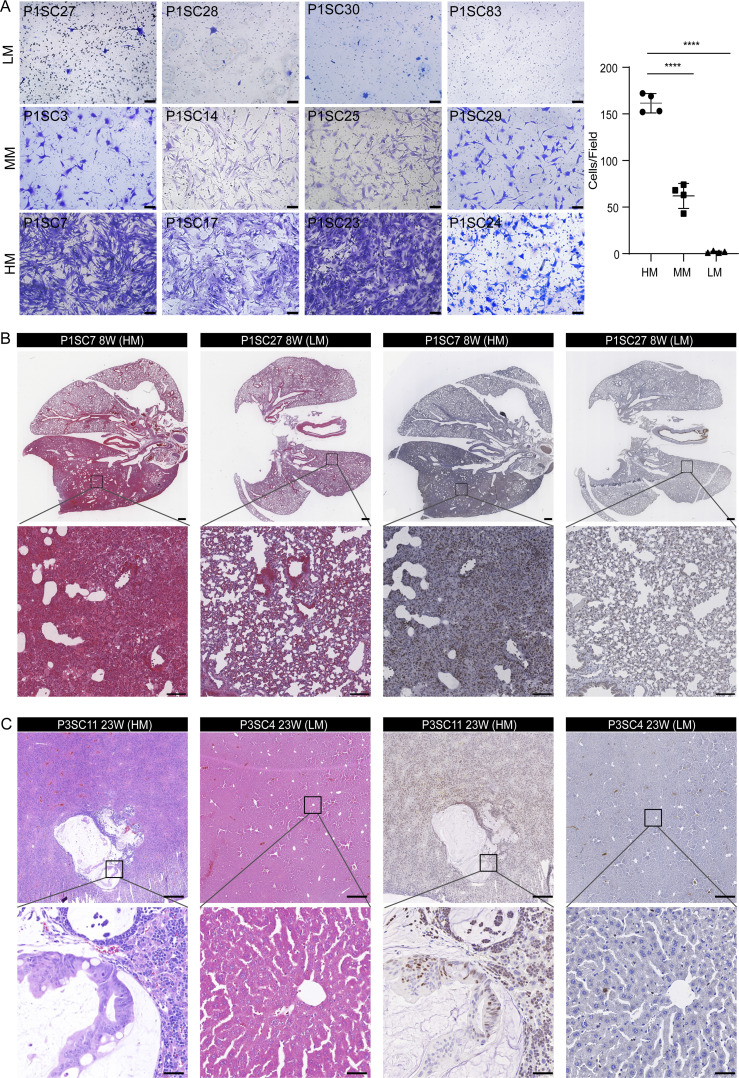
Figure 2.
Identification of SC-PDCC lines with distinct metastatic potential from the same primary CRC tumor. (A) In vitro invasion assay of 12 SC-PDCC lines in P1. Cells were seeded in a Matrigel-coated Transwell and were cultured in serum-free media. The bar graphs represent the relative numbers of invaded cells. The invaded cells were counted in five randomly chosen areas (repeat, n = 3). Error bars represent SD of the mean. ****, P < 0.0001; by two-tailed unpaired Student’s t test. n = 4 for each group. Scale bar, 100 µm. HM, high metastatic potential; MM, moderate metastatic potential; LM, low metastatic potential. (B) Representative H&E staining and KI67 staining images of lung metastases derived from P1 SC-PDCC lines with high and low metastatic potential. P1SC7, n = 8; P1SC27, n = 15. Scale bar: up, 500 µm; down, 100 µm. (C) Representative H&E staining and KI67 staining images of liver metastases derived from P3 SC-PDCC lines with high and low metastatic potential. P3SC11, n = 4; P3SC4, n = 9. Scale bar: up, 500 µm; down, 50 µm.

