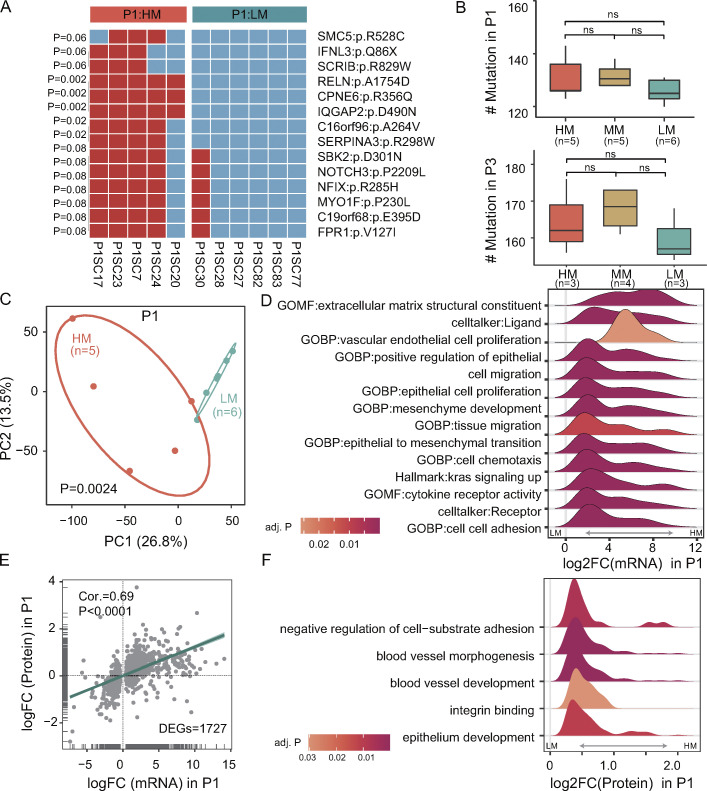
Figure 3.
Molecular characteristics of metastatic SC-PDCC lines. (A) 14 non-synonymous mutations enriched in the high metastatic potential (HM) SC-PDCC lines of P1. Fisher test, two-tailed; HM, n = 5; LM, n = 6. (B) Comparison of the numbers of SNVs between low metastatic potential (LM), moderate metastatic potential (MM), and HM in P1 and P3. P > 0.1; the Mann–Whitney test, two-tailed, was used. For P1, HM, n = 5; LM, n = 6. For P3, HM, n = 3; LM, n = 3. (C) PCA showing the essential difference between HM (red, n = 5) and LM (blue, n = 6) SC-PDCC lines of P1. Significance determined by PERMANOVA test, P = 0.0024. (D) GSEA analysis of differential enrichment of molecular pathways at the mRNA level in the HM (n = 5) and LM (n = 6) SC-PDCC lines from P1. The gene sets were collected from the Molecular Signatures Database. (E) Correlation between mRNA and protein levels of 1,727 DEGs (P < 0.1) in HM (n = 4) and LM (n = 2) SC-PDCC lines from P1. Evaluated using Spearmans correlation coefficient. (F) GSEA analysis of pathways differentially enriched at the protein level in HM (n = 4) and LM (n = 2) SC-PDCC lines from P1. FC, fold change.

