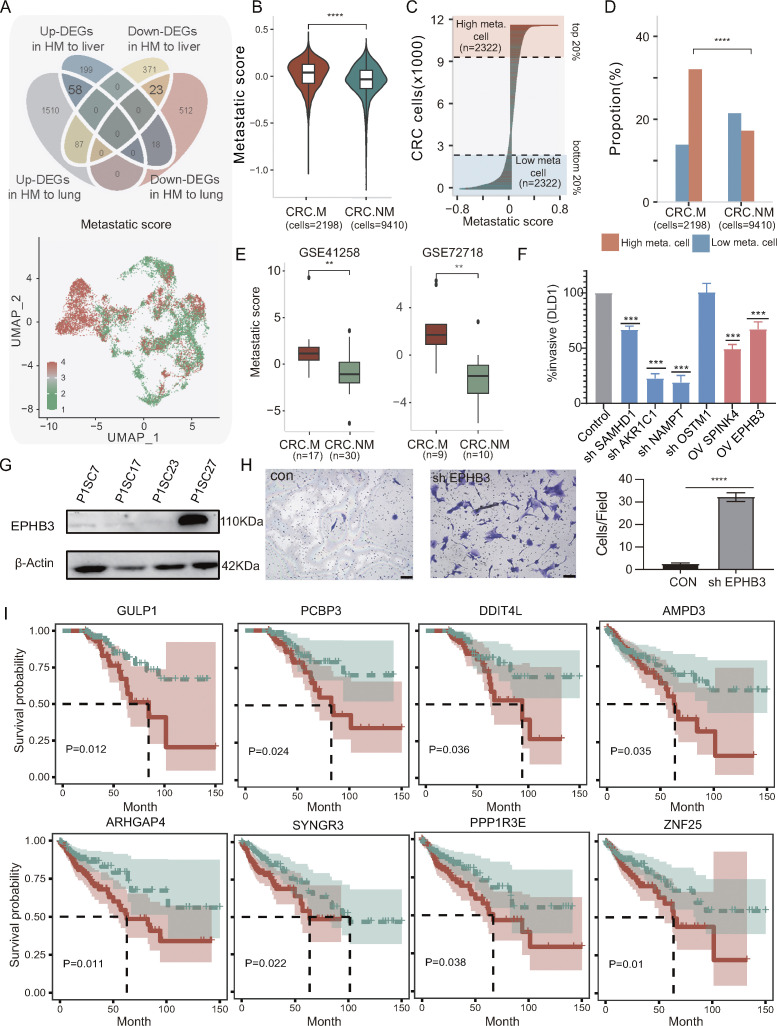
Figure 4.
Identification of metastatic signature and driver genes in primary CRC tumors. (A) Top: Venn diagram illustrating the metastatic signature derived from the overlapping sets of DEGs between high and low metastatic SC-PDCC lines from P1 and P3. For P1, high metastasis, n = 2; low metastasis, n = 2; for P3, high metastasis, n = 2; low metastasis, n = 1. Bottom: Distribution of high metastatic potential (HM) and low metastatic potential (LM) signature in cancer cells. Each dot represents a cell (Xu et al. [2022] dataset PRJNA748525). The HM score and LM signature were calculated based on shared significantly upregulated and downregulated genes in high metastatic SC-PDCC lines from P1 and P3. (B) Comparison of the difference in metastatic score between the CRC.M and CRC.NM groups (from Xu et al. [2022] dataset PRJNA748525). Metastatic score was calculated by subtracting the LM signature from the HM signature. The P value was measured by Wilcoxon test; the number (n) is indicated. (C) Distribution of metastatic score among cells; the number (n) is indicated. (D) Proportion comparison of different cell sources between risk groups. P values were calculated by Chisq test. ****, P < 0.0001. (E) Comparison of metastatic scores between primary CRC with and without liver metastasis. P value calculated by Wilcoxon test, with the number of samples (n) indicated. Data obtained from GSE41258 and GSE72718 datasets. **, P < 0.01. (F) Quantification of invasive assays following knockdown or overexpression of target gene in DLD1, respectively. Knockdown assays were performed using two independent shRNAs per gene (repeat, n = 3). Differences in invasion phenotype relative to control shRNAs (control) were significant by two-tailed t test, error bars show SD across three reduplicates, ***, P < 0.001. (G) Western blot analysis showing elevated expression of EPHB3 in LM SC-PDCC line (P1SC27), repeat, n = 3. (H) Knockdown of EPHB3 increases invasion of LM SC-PDCCs. The invaded cells were counted in five randomly chosen areas (n = 3; ****, P < 0.0001). Scale bar, 50 µm. (I) The Kaplan–Meier curves of patient outcomes were plotted for the TCGA-COAD cohort (cases = 458) based on indicated genes. The red and blue lines represent patients with upregulated and downregulated genes in HM SC-PDCC lines, respectively. The significance of differences between the two groups was assessed using a Cox test. Dotted line represents median survival. The plus signs represent the censored cases. Source data are available for this figure: SourceData F4.

