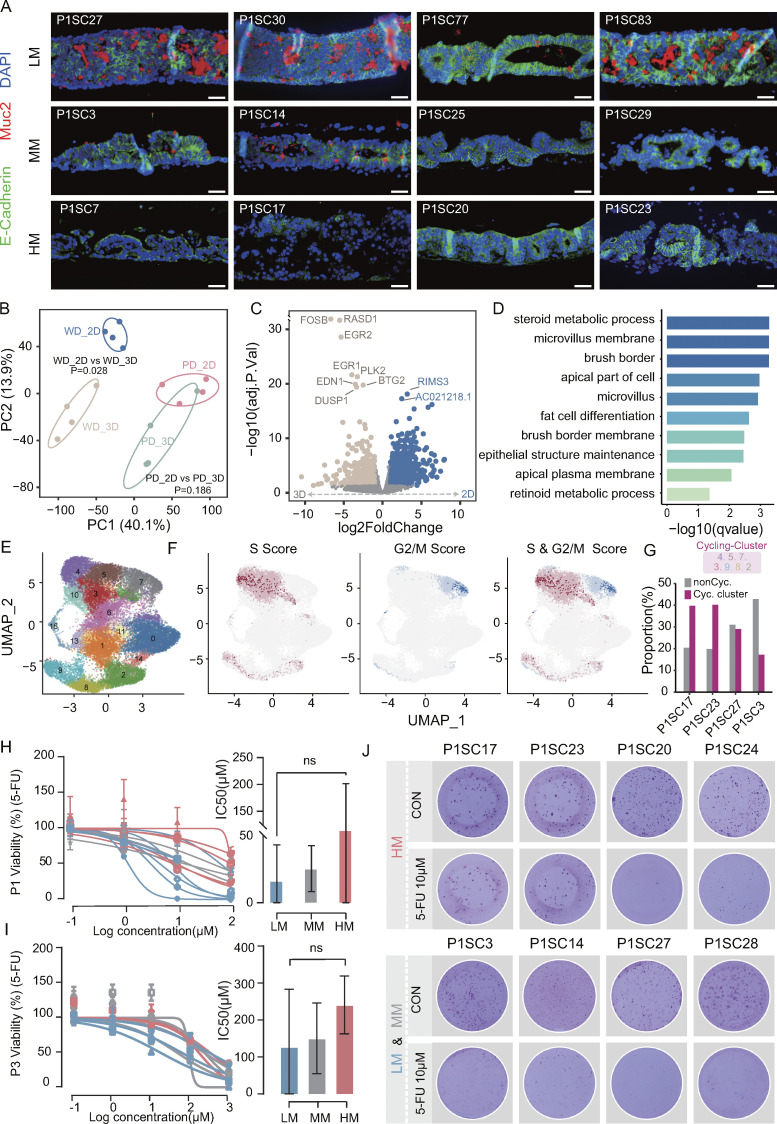
Figure 6.
Differentiation potential and drug response of SC-PDCC lines with different metastatic potential. (A) MUC2 (red) and E-cadherin (green) staining of ALI PDOs derived from different SC-PDCC lines with different metastatic potential in P1. Scale bar, 50 µm. HM, high metastatic potential; MM, moderate metastatic potential; LM, low metastatic potential; HM, n = 4; MM, n = 4; LM, n = 4. (B) PCA showing high similarity between the SC-PDCC lines (PD_2D) and poorly differentiated ALI PDOs (PD_3D) (P = 0.186), and great difference between the SC-PDCC lines (WD_2D) and moderately differentiated ALI PDOs (WD_3D) (P = 0.028). Significance was determined by PERMANOVA test (all SC-PDCC lines from P1; n = 4 for each group). WD, well differentiation; PD, poor differentiation. (C) Volcano plot of genes that were differentially expressed between WD SC-PDCCs and their derived ALI PDOs. DEGs were determined based on adjusted (P < 0.05) and log2 fold-change (absolute value >1). n = 4 for both the WD_2D group and the WD_3D group. (D) GOEA of DEGs between WD SC-PDCCs and their derived ALI PDOs in P1. (E) UMAP plot of single-cell RNA expression from two HM SC-PDCC lines (P1SC17 and P1SC23) and one MM SC-PDCC lines (P1SC3) and one LM SC-PDCC lines (P1SC27). Color code for cell type assignment. (F) Cell cycle scores for each cell based on the expression of S and G2/M phase genes. (G) Relative fractions of cycling and noncycling cells across four SC-PDCC lines in P1. (H and I) Dose-response curves of SC-PDCC lines with different metastatic potential from P1 and P3 after 6 days treatment with 5-FU. Error bars represent SEM of three independent experiments; HM, n = 5; MM, n = 3; LM, n = 6. (J) The drug response indicated by SC-PDCC lines from P1 treated with 10 µM 5-FU. Cells were fixed, rhodamine stained, and photographed after 6 days of treatment. HM, n = 4; MM, n = 2; LM, n = 2. Three technical replicates for each SC-PDCC line.

