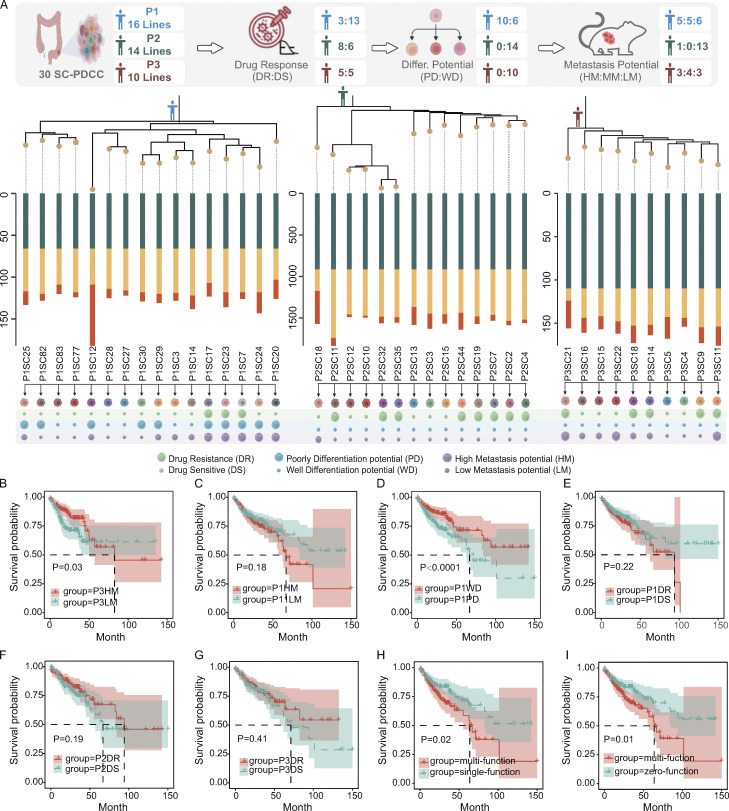
Figure 7.
Metastasis evolution and the impact of clinical prognosis of metastatic potential. (A) Phylogenetic trees were constructed using SNVs from SC-PDCC lines of three individuals, integrating functional heterogeneity. Branch lengths indicate mutation numbers. Colored labels correspond to each function. The size represents the strength of each function. (B and C) Kaplan–Meier curves of patients according to DEGs between HM and LM SC-PDCC lines from P3 (B) and P1 (C) in the TCGA-CAOD cohort (cases = 458). Red and blue lines denote the patients with genes highly expressed in HM and LM SC-PDCC lines, respectively. Significance of differences between the two groups was assessed by Cox test (B, P = 0.03; C, P = 0.18). HM, high metastatic potential; LM, low metastatic potential. Dotted line represents median survival. The plus signs represent the censored cases. (D) Kaplan–Meier curves of patients according to DEGs between WD and PD SC-PDCC lines from P1 in the TCGA-CAOD cohort (cases = 458). Red and blue lines denote the WD and PD SC-PDCC lines, respectively (P < 0.0001). WD, well differentiation potential; PD, poor differentiation potential. (E–G) Kaplan–Meier curves of patients according to DEGs between DR and DS SC-PDCC lines from P1 (E), P2 (F), and P3 (G) in the TCGA-CAOD cohort (cases = 458). Red and blue lines denote the DR and DS SC-PDCC lines, respectively (E, P = 0.22; F, P = 0.19; G, P = 0.41). DR, drug resistant; DS, drug sensitive. (H and I) Kaplan–Meier curves of patients according to DEGs between multitask and single-task SC-PDCC lines (H) and between multitask and zero-task SC-PDCC lines (I) from P1 in the TCGA-CAOD cohort (cases = 458). Red line denotes the mutitask SC-PDCCs, blue line denotes the single-task (H) or zero-task (I) SC-PDCC lines (H, P = 0.02; I, P = 0.01).

