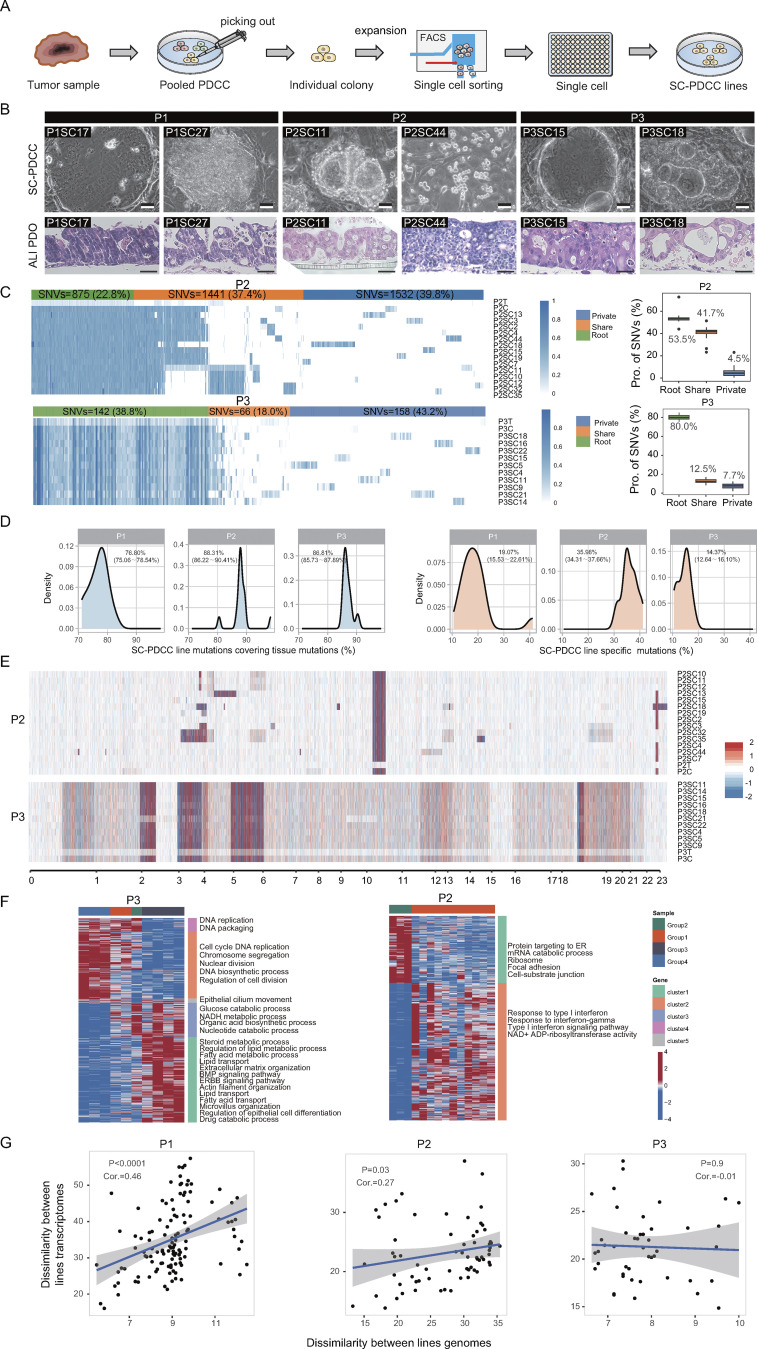
Figure S1.
SC-PDCC lines recapitulate the intratumoral heterogeneity of the histology, genomic, and transcriptional landscape, related to Fig. 1. (A) Schematic procedure of establishing SC-PDCC lines from CRC patient. Colonies were generated after processing tissues, different morphological colonies were picked and expanded, then sorted using EPCAM+ to obtain single cell per well. SC-PDCC lines were established after expansion. (B) Representative bright field microscopy and H&E staining images of SC-PDCC colonies and matched 3D ALI PDOs from three patients. Scale bar, 50 µm. (C) In the left panel, a heatmap illustrating the allele frequency of SNVs in the parental tumor, pooled PDCCs, and SC-PDCC lines of P2 (up, n = 16) and P3 (down, n = 12). Variations are classified as: root (present in all samples), share (present in multiple samples but not all), and private (present in specific samples). In the right panel, the boxplot shows the distribution of each SNV types among samples, and the labeled numbers indicate the median proportion of mutations. (D) Distribution of mutations in SC-PDCC lines, including retained parental tumor mutations (left) and SC-PDCC line-specific mutations (right). (E) Heatmap shows CNAs in parental tumor, pooled PDCCs, and different SC-PDCC lines of P2 (up, n = 16) and P3 (down, n = 12). Red denotes copy number gains, and blue denotes copy number loss. (F) GOEA of consensus clustered genes in P2 (right, n = 14) and P3 (left, n = 10). Each column represents a SC-PDCC sample, and samples were grouped based on the top 1,000 highly variable genes. Rows represent DEGs (padj < 0.05 and |log2fold-change| > 0.5), which was the result of comparing each sample group with other samples. (G) Effects of mutations in exons on the transcriptome. Each data point represents the genomic dissimilarity (x-axis) and transcriptomic dissimilarity (y-axis) of a cell line pair. Consistency was assessed using the Spearman correlation coefficient.

