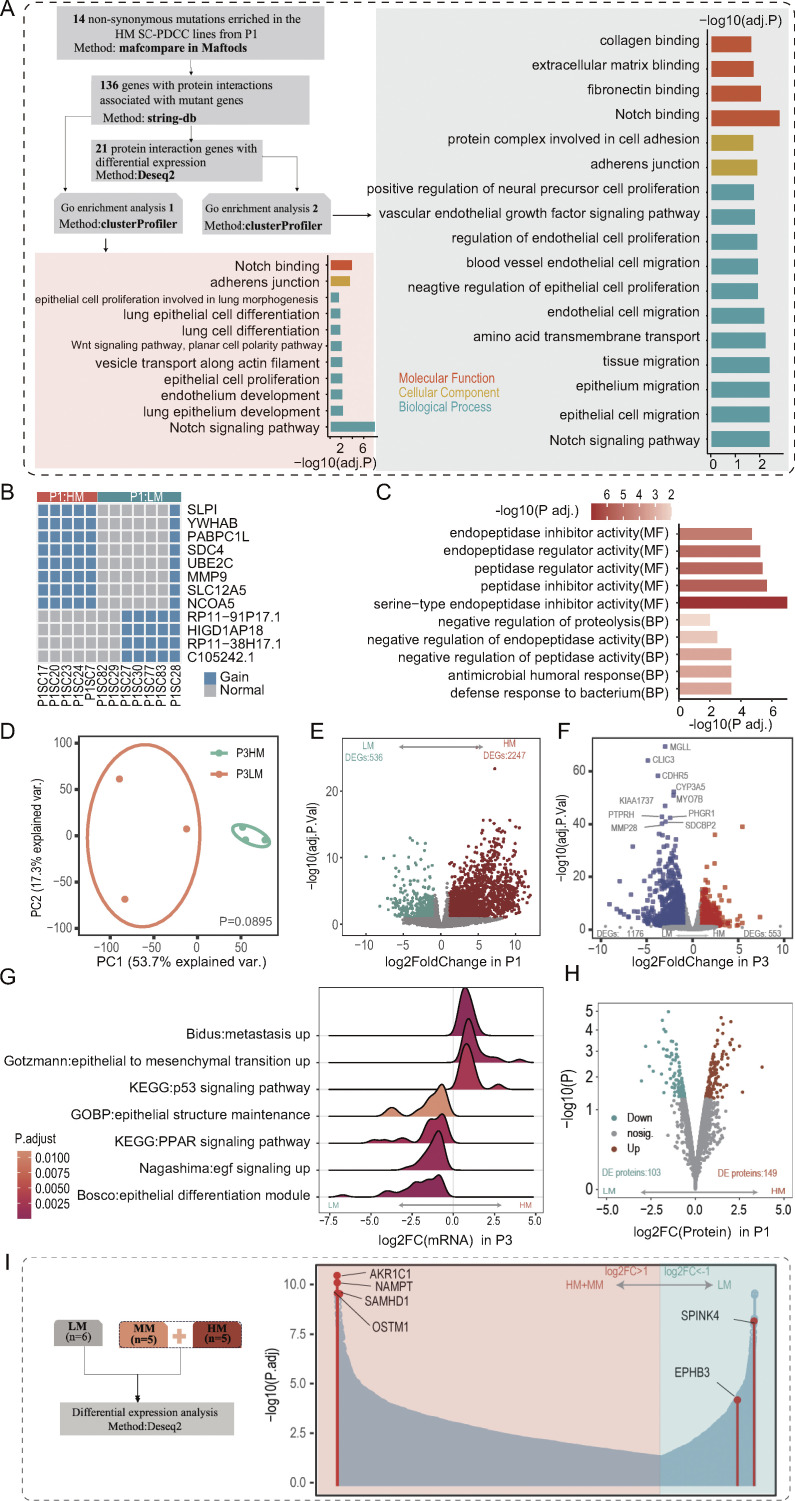
Figure S3.
Molecular divergence of metastatic SC-PDCC lines from individual tumors, related to Fig. 3. (A) 14 non-synonymous mutations were enriched in HM SC-PDCC lines of P1. GOEA of genes with protein interactions with these mutations, as well as signaling pathways enriched for DEGs associated with these mutant genes. (B) Specific amplified genes present in HM SC-PDCC lines from P1. Fisher’s test was used to analyze different CNAs; HM, n = 5; LM, n = 7. (C) GO terms enriched by the differential CNAs between HM SC-PDCC lines and LM SC-PDCC lines in P1. BP, biological process; MF, molecular function. (D) PCA showing the difference between HM SC-PDCC lines (n = 3) and LM SC-PDCC lines (n = 3) in P3. The P value was determined by PERMANOVA test, P = 0.089. (E and F) Volcano plot of genes that were differentially expressed between HM SC-PDCCs and LM SC-PDCCs in P1 (C, HM, n = 5, LM, n = 6) and P3 (D, HM, n = 3, LM, n = 3). (G) GSEA showing significantly enriched pathway in HM and LM SC-PDCC lines of P3, respectively, P values are shown. GOBP, GO terms of biological process. (H) Volcano plot showing the differentially expressed proteins between HM SC-PDCCs (n = 4) and LM SC-PDCCs (n = 2) in P1. (I) Six genes were selected for functional verification. Differential analysis was performed based on SC-PDCC lines from P1, the number (n) is indicated. HM, high metastatic potential; MM, moderate metastatic potential; LM, low metastatic potential.

