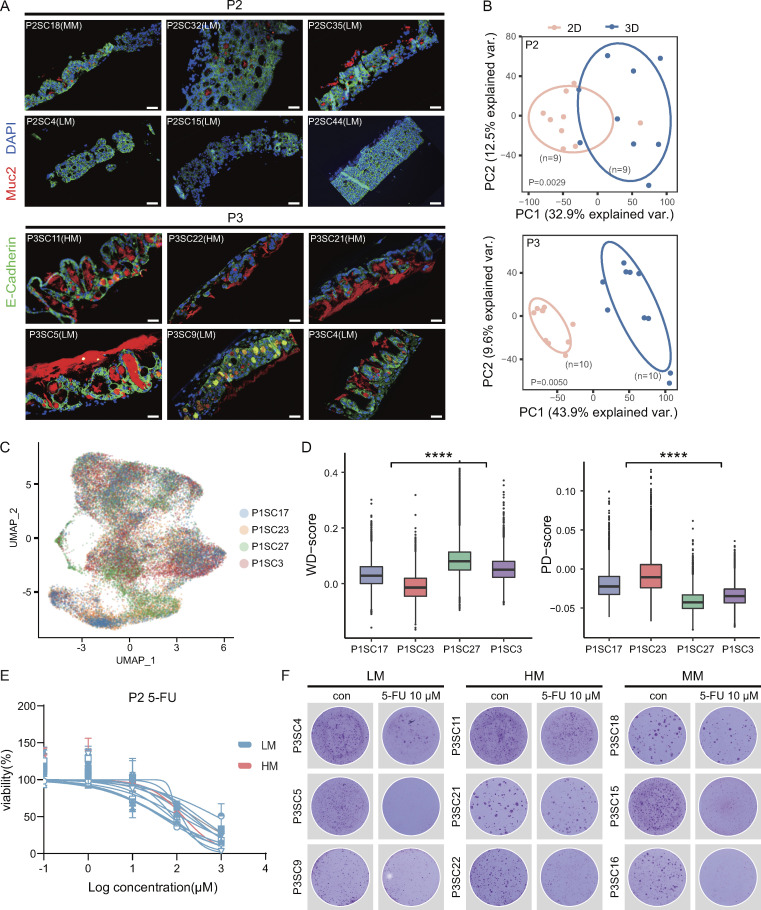
Figure S5.
Assessment of differentiation potential and drug response of SC-PDCC lines with different metastatic potential, related to Fig. 6. (A) MUC2 (red) and E-cadherin (green) staining of ALI PDOs derived from different SC-PDCC lines in P2 (n = 6) and P3 (n = 6), respectively. Scale bar, 50 µm. (B) PCA showing large difference between the SC-PDCC lines (2D) and corresponding ALI PDOs (3D) in P2 (n = 9) and P3 (n = 9). Significance was determined by PERMANOVA test; P2, P = 0.0029; P3, P = 0.005. (C) UMAP plot of single-cell RNA expression from two PD SC-PDCC lines (n = 2; P1SC17 and P1SC23) and two MD SC-PDCC lines (n = 2; P1SC3 and P1SC27) in P1. Color code for different samples. MD, moderate differentiation; PD, poor differentiation. (D) Differentiation score and undifferentiated score of single cells in four SC-PDCC lines. These scores were evaluated by the expression of DEGs from bulk RNA data of corresponding WD SC-PDCCs and PD SC-PDCCs. Two WD SC-PDCC lines (P1SC3 and P1SC27) showed higher WD scores (left), and two PD SC-PDCC lines (P1SC17 and P1SC23) showed higher PD scores (right). The Mann–Whitney test, two-tailed, was used. ****, P < 0.0001. (E) Dose-response curves of SC-PDCC lines (n = 14) with different metastatic potential from P2 after 6 days treatment with 5-FU (repeat, n = 3). Error bars represent the SEM of three independent experiments. (F) The functional phenotypes of drug response indicated by SC-PDCC lines from P3 treated with 10 µM 5-FU (n = 9). Cells were fixed, rhodamine stained, and photographed after 6 days of treatment. Three technical replicates for each SC-PDCC line. HM, high metastatic potential; MM, moderate metastatic potential; LM, low metastatic potential.

