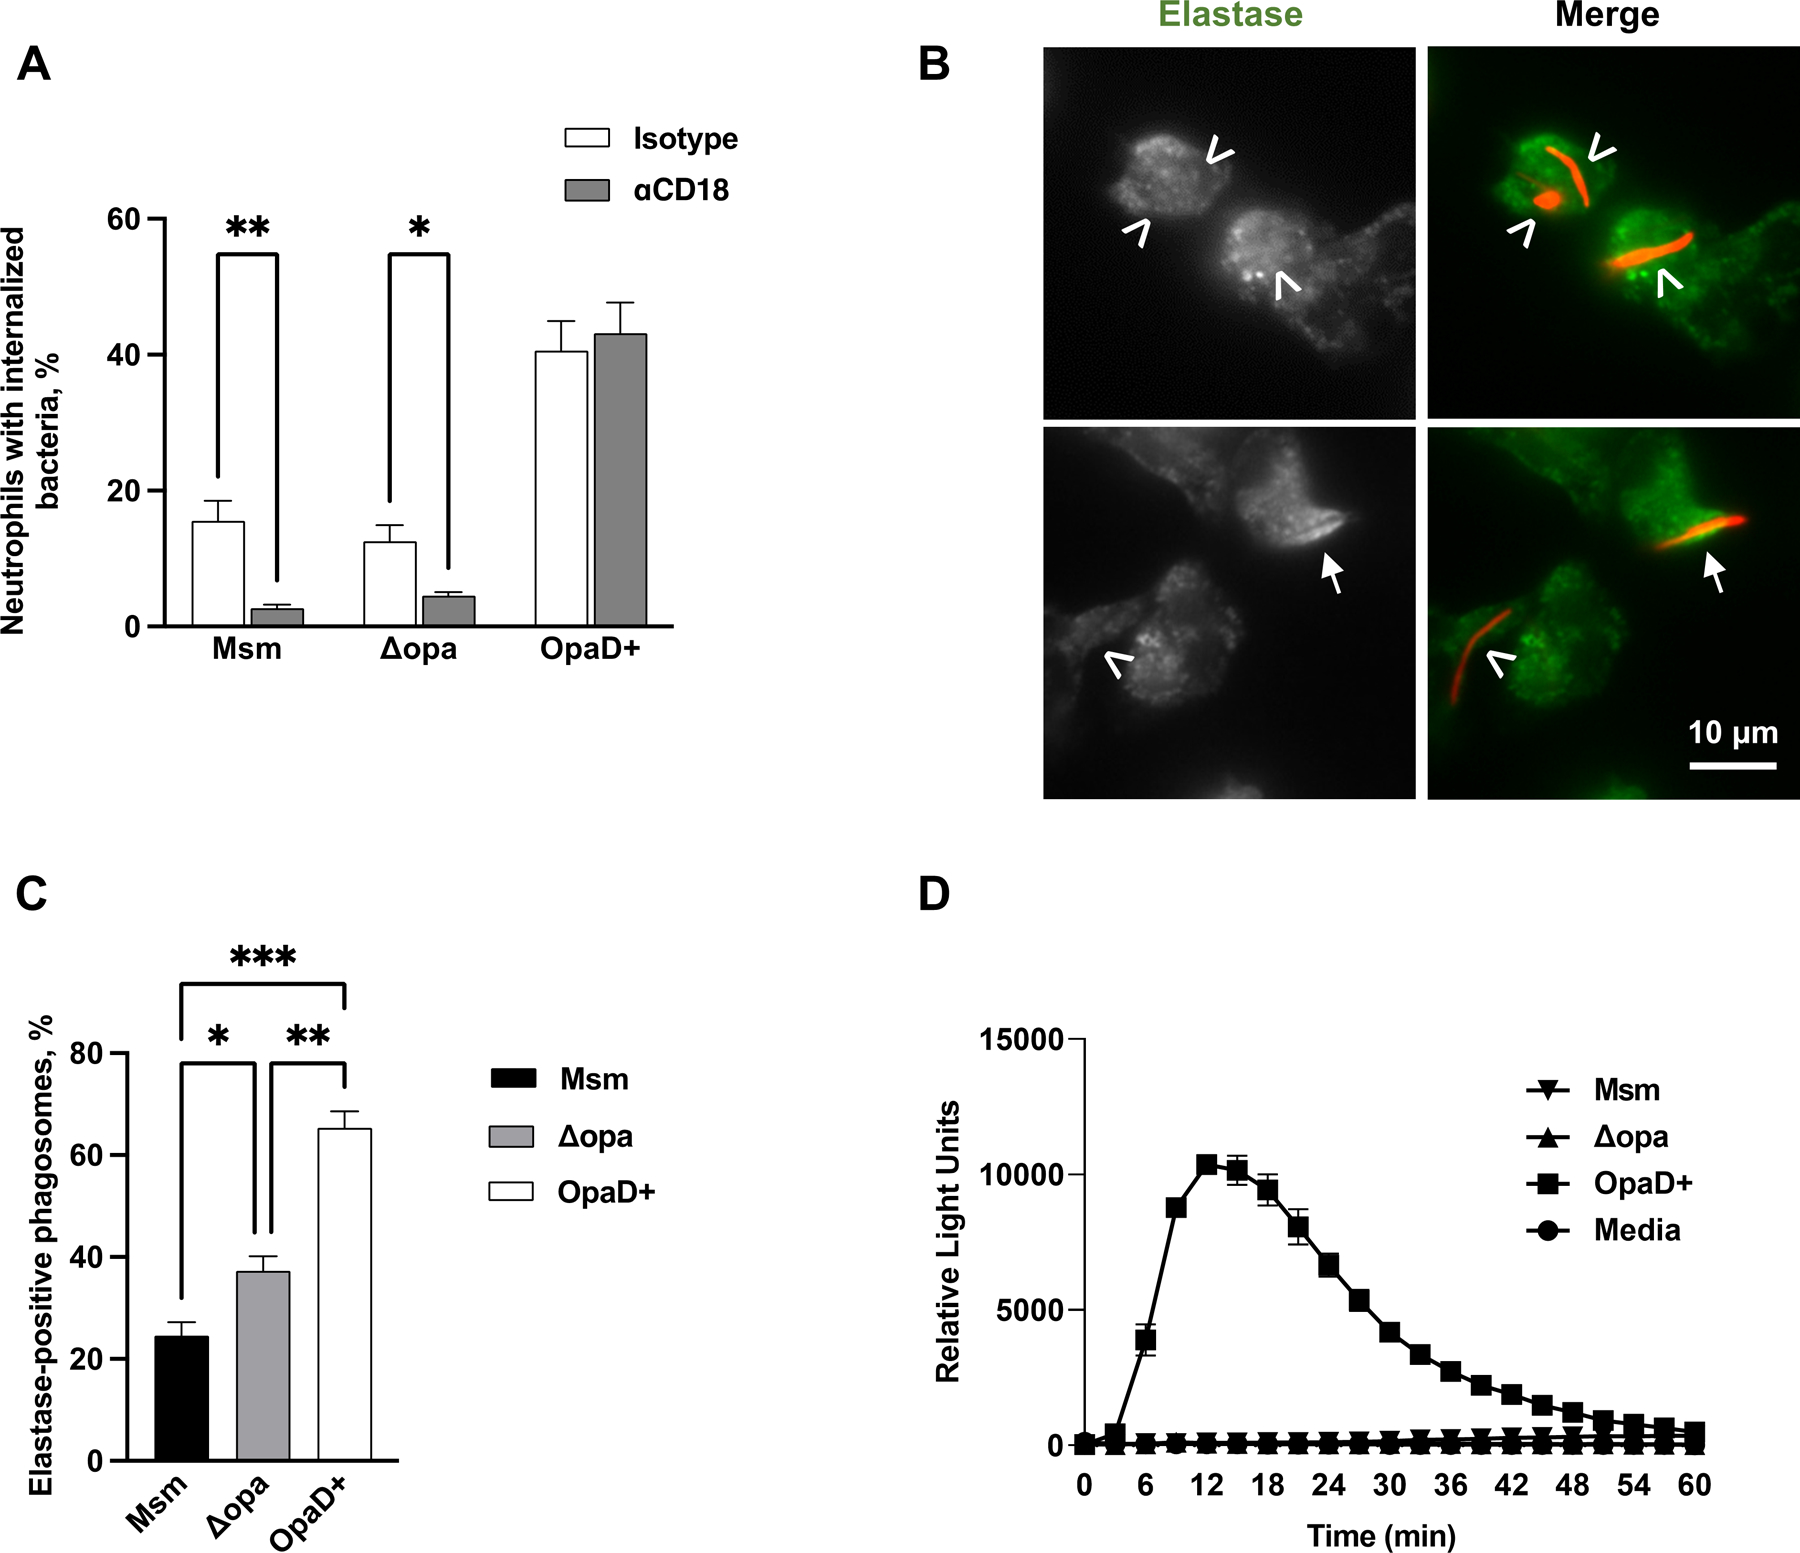
Figure 7. Phagocytosis of M. smegmatis by human neutrophils is CR3-dependent and does not stimulate the oxidative burst or full phagosome maturation.

(A) Adherent, IL-8 treated human neutrophils were treated with either isotype control or anti-CD18 antibody, then exposed to Tag-IT Violet™ labeled M. smegmatis (Msm) for 1 hr. Neutrophils were fixed, stained for CD11b, and examined by imaging flow cytometry. Intracellular bacteria were defined as those within a mask set by the CD11b surface staining eroded by 4 pixels and quantified by spot count (see Fig. S9). The percent of neutrophils with intracellular M. smegmatis, Δopa Ngo, and OpaD+ Ngo, with and without CD18 blockade, was calculated from 5 biological replicates and presented as the mean ± SEM. (B-C) Adherent, IL-8 treated human neutrophils were infected with mCherry-expressing M. smegmatis at MOI = 5 for 1 hr (red). Cells were fixed, permeabilized and stained for neutrophil elastase (green). Two representative panels with neutrophils and M. smegmatis are shown in (B), with the grayscale elastase signal on the left and merged fluorescence image with M. smegmatis on the right. The arrows identify elastase-positive phagosomes; arrowheads, elastase-negative phagosomes. The percent of elastase-positive phagosomes containing M. smegmatis, Δopa Ngo, and OpaD+ Ngo was quantified from 50–100 phagosomes per condition. Results presented are the mean ± SEM from 4 biological replicates. (D) Primary human neutrophils were left uninfected (media) or exposed to M. smegmatis, or Δopa or OpaD+ Ngo at MOI = 100. ROS production by luminol-dependent chemiluminescence was measured as in Fig. 1E. The graph shown is from one representative of 3 biological replicates. Each data point is the mean ± SEM from three technical replicates. Statistical significance was determined by statistical Student’s paired t test (A) or repeated measures one-way ANOVA followed by Tukey’s multiple comparisons test (C). * P ≤ 0.05, ** P ≤ 0.01, *** P ≤ 0.001.
