
Extended Data Fig. 9 |. In silico deletion strategy revealed network connectivity.
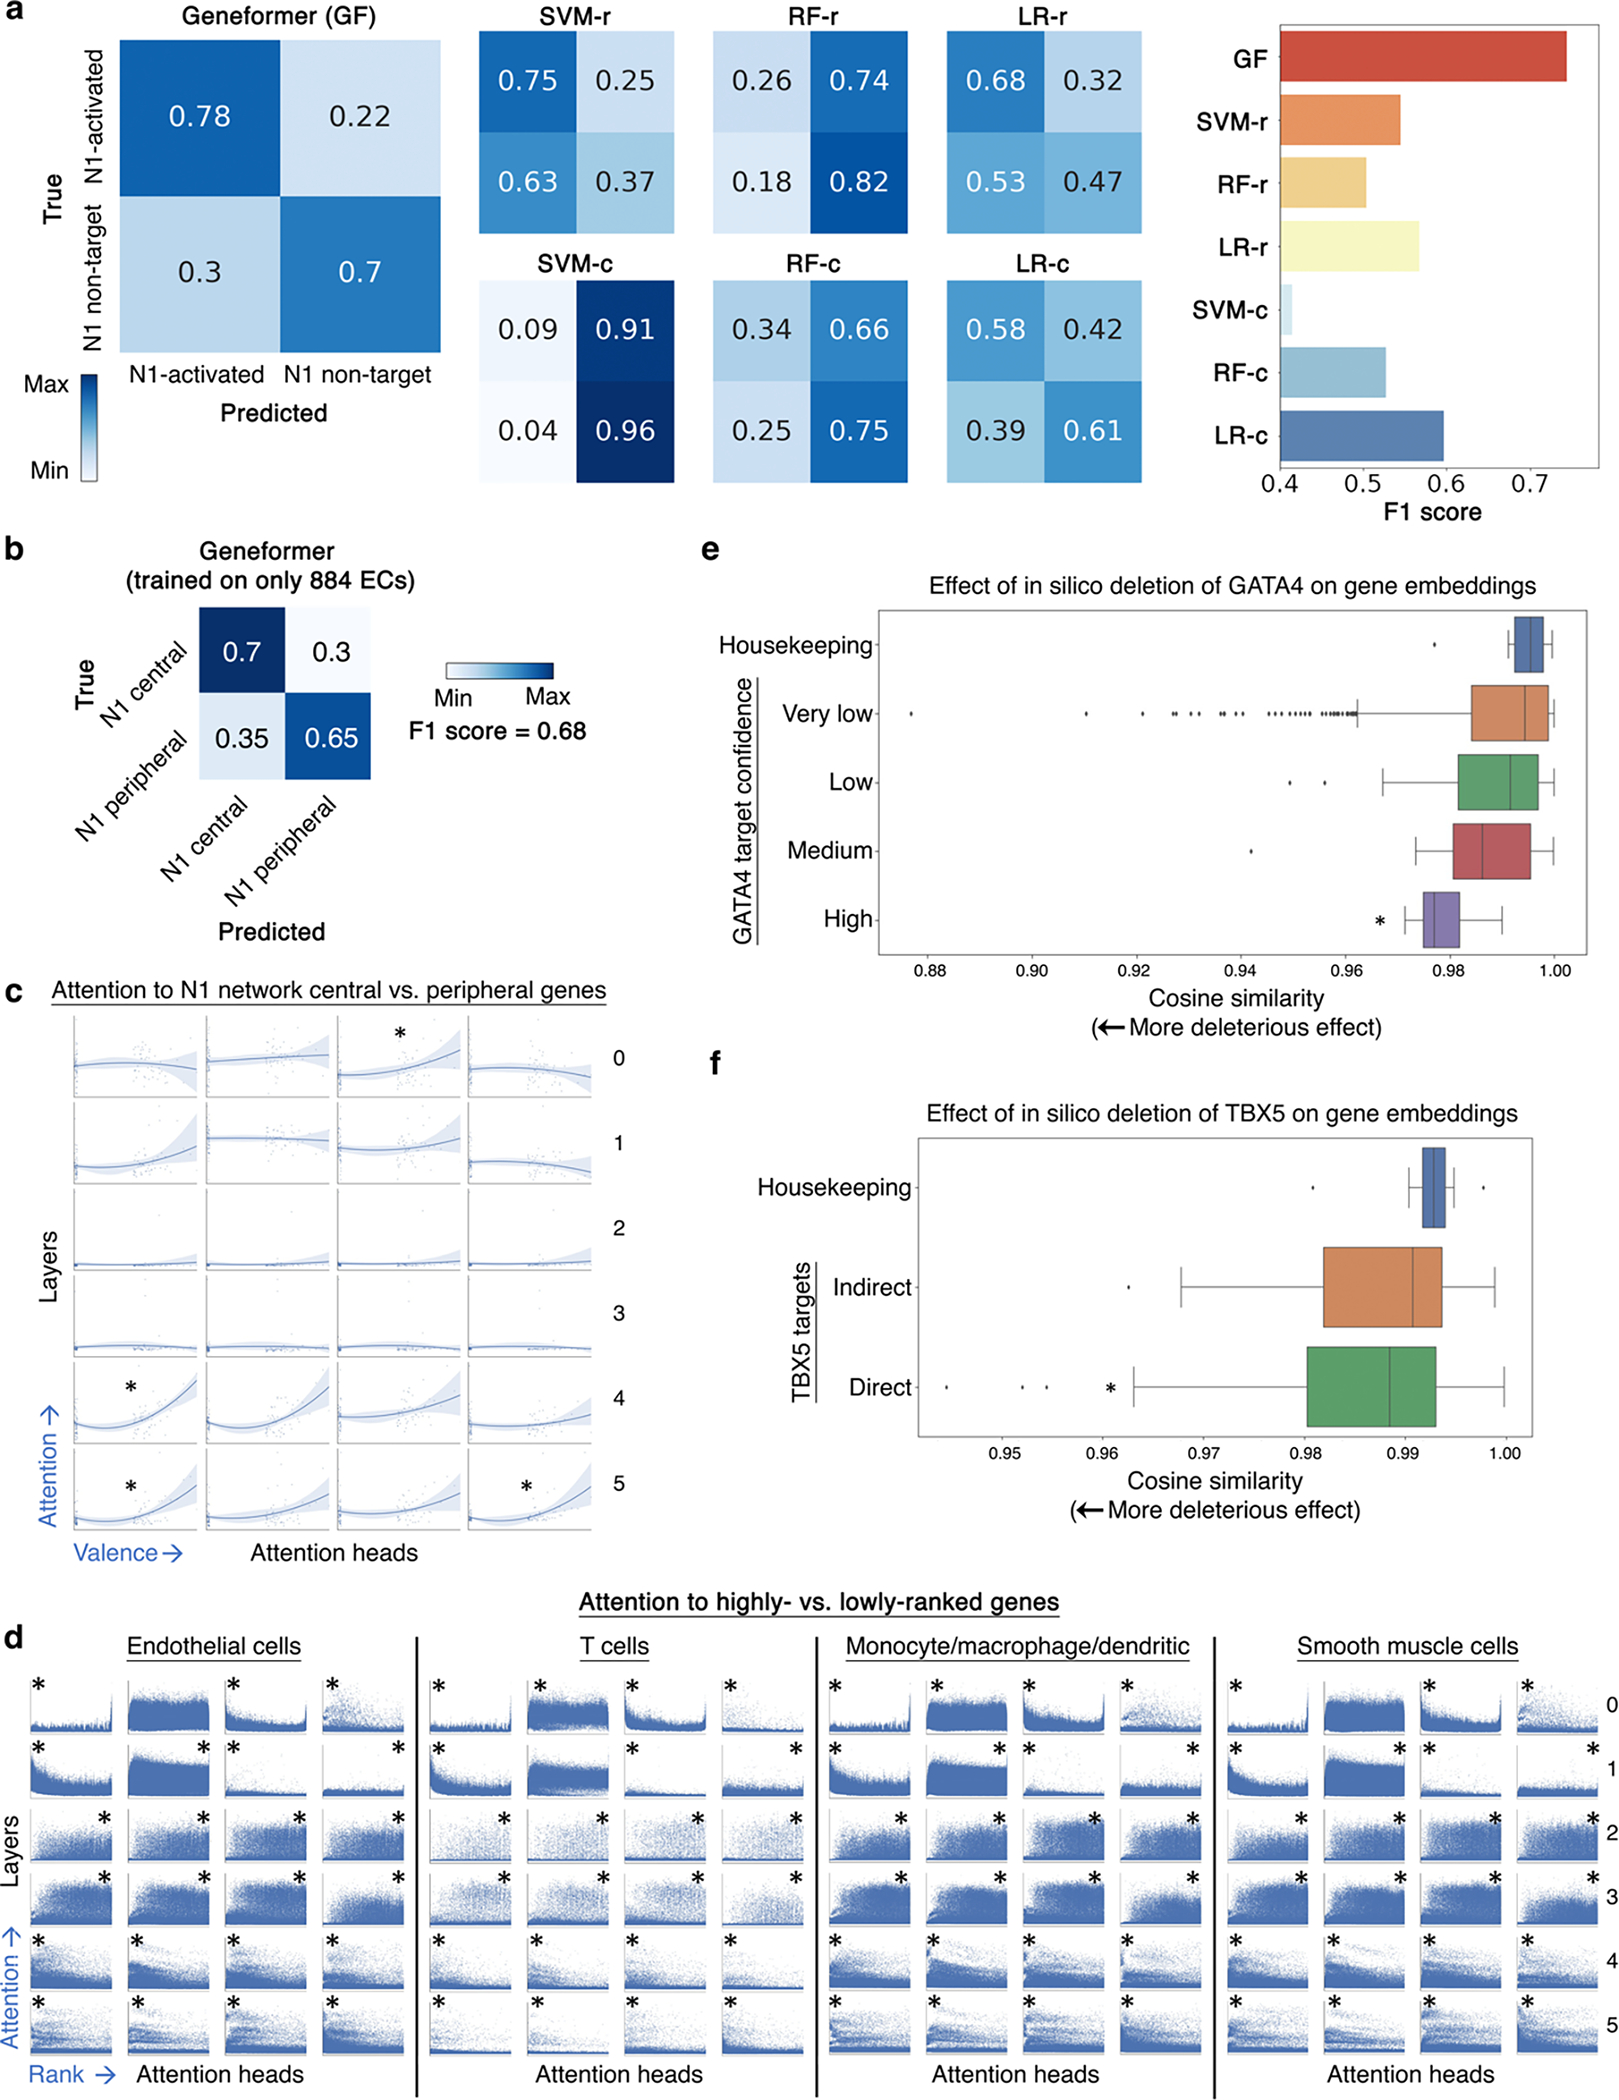
a, Confusion matrices and F1 score for Geneformer predictions vs. alternative methods (as described in Fig. 2a) for downstream task of distinguishing N1-activated vs. non-targets. b, Confusion matrix and F1 score of Geneformer predictions of central vs. peripheral genes within the N1-dependent network in endothelial cells (ECs) with model fine-tuned only on 884 ECs from healthy or dilated aortas14. c, Pretrained Geneformer attention weights in aortic ECs demonstrated that specific attention heads learned in a completely self-supervised way the relative centrality of the top most central versus most peripheral genes in the N1-dependent gene network (higher valence=more central) (*p<0.05 Wilcoxon, FDR-corrected). d, Pretrained Geneformer contextual attention versus gene rank in rank value encoding in the indicated aortic cell types, which each have different sets of highest ranked genes based on cell type context (higher rank is leftward on x axis) (*p<0.05 by Wilcoxon, FDR-corrected, * position = side with higher attention). All cells used for analysis had the same number of genes so that the rank values would be comparable. e, In silico deletion of GATA4 was significantly more deleterious to the previously reported highest confidence GATA4 targets33 than to housekeeping genes. f, In silico deletion of TBX5 was significantly more deleterious to previously reported TBX5 direct targets34 than to housekeeping genes or TBX5 indirect targets. In (d-e): *p<0.05 by Wilcoxon, FDR-corrected; center line=median, box limits=upper and lower quartiles, whiskers=1.5x interquartile range, points=outliers.