
Fig. 4 |. Geneformer encoded gene network hierarchy.
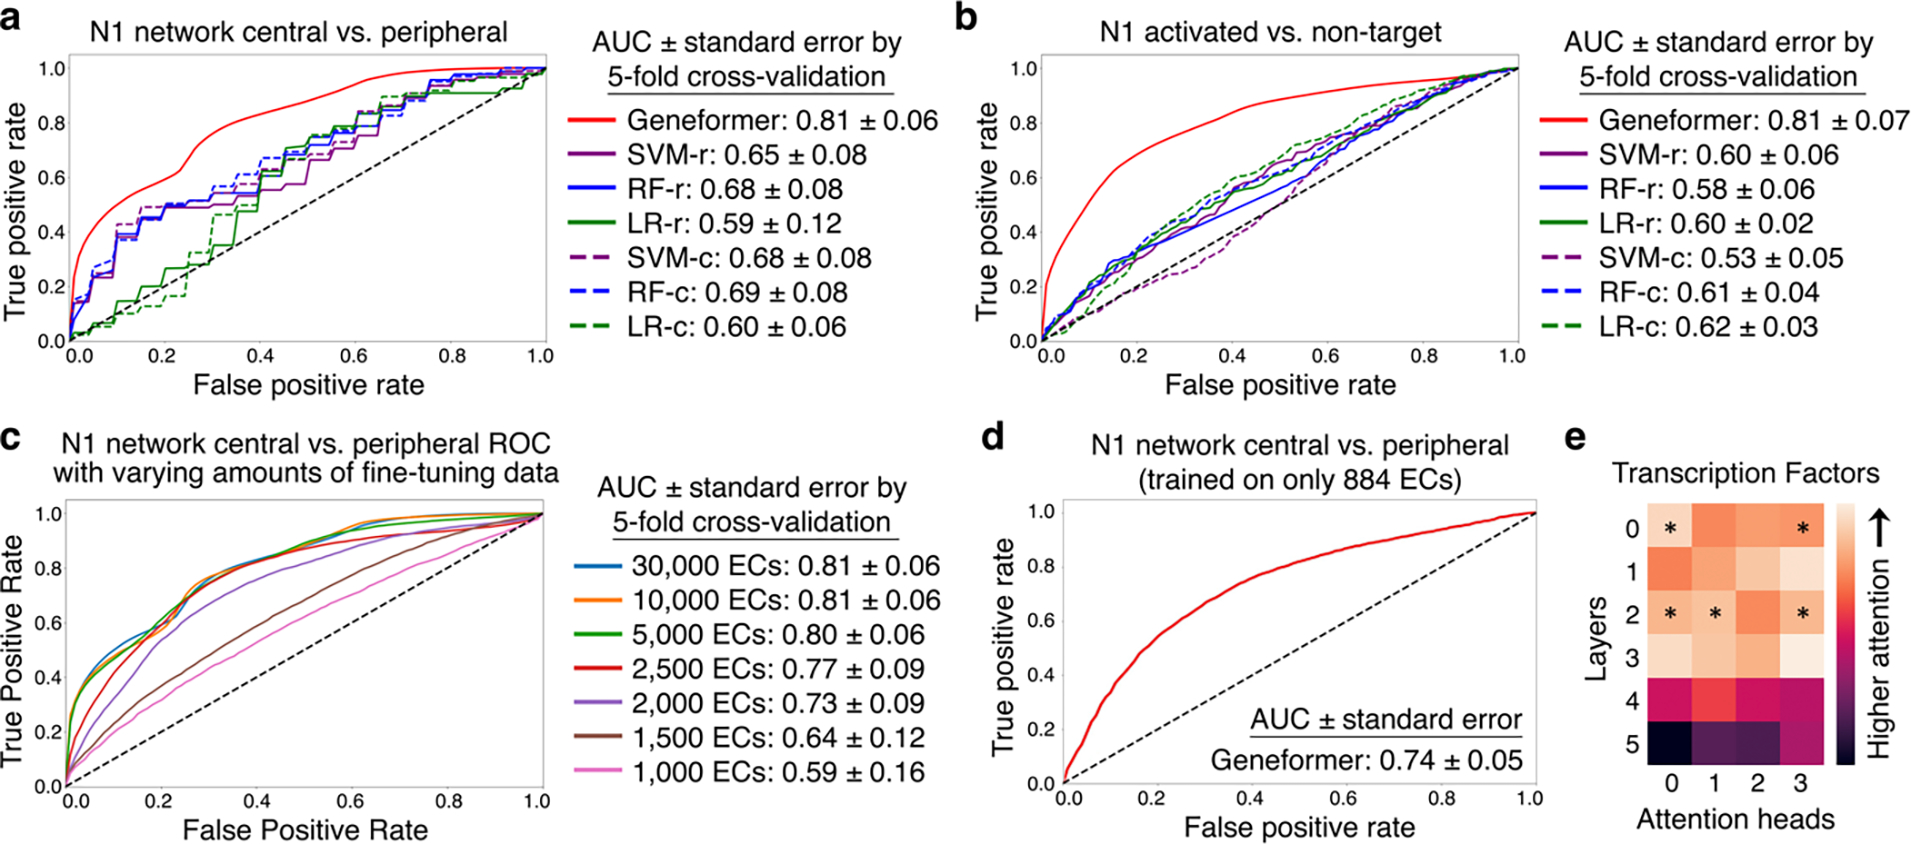
a, ROC curve of Geneformer fine-tuned to distinguish central versus peripheral genes within the N1-dependent gene network using limited data (~30K ECs), compared to alternative methods. b, ROC curve of Geneformer fine-tuned to distinguish N1 activated versus non-target genes using limited data (~30K ECs), compared to alternative methods. c, ROC curve of Geneformer fine-tuned to distinguish central versus peripheral genes within the N1-dependent gene network using increasingly limited data (1K-30K ECs). d, ROC curve of Geneformer fine-tuned to distinguish central versus peripheral genes within the N1-dependent gene network using increasingly limited but more relevant data (884 ECs from healthy or dilated aortas). AUC was higher than alternative methods trained on larger dataset of ~30K ECs (Fig. 3a). e, Pretrained Geneformer attention weights of transcription factors indicated that the model learned in a completely self-supervised way the relative importance of transcription factors, which were more highly attended than other genes in 20% of attention heads (p<0.05, Wilcoxon rank sum, FDR correction) and were more attended in earlier layers (p<0.05, Wilcoxon rank sum). (Alternative methods described in Fig. 2.)