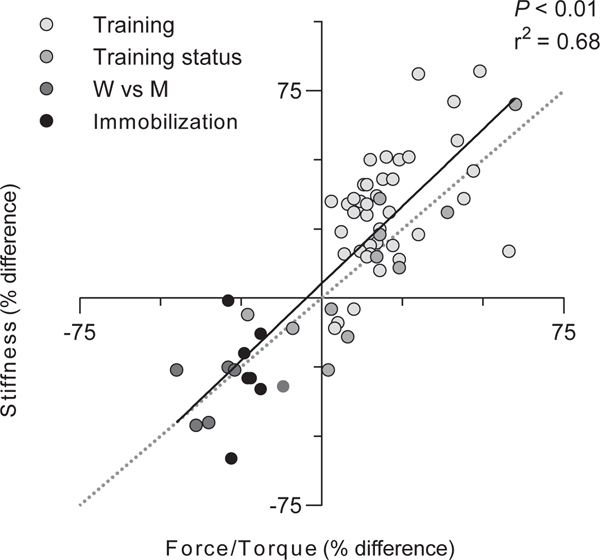
Fig. 3.
Relationship between changes (i.e., following an intervention) or differences (i.e., between groups) in metrics of muscle strength and changes or differences in tendon or tendinous tissue (tendon and aponeurosis) stiffness. Data are fitted with a linear regression (black line). Dotted line (grey) represents unity. Data values and sources can be found in supplemental table 1. W, women. M, men.

