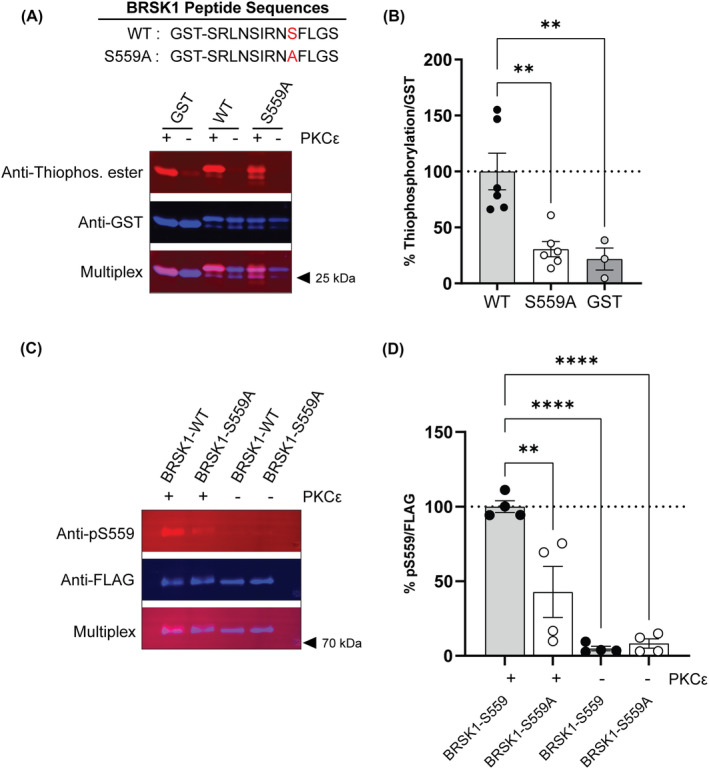
FIGURE 1.

PKCε phosphorylates BRSK1 in vitro at S559. A) The average ratio of thiophosphorylation/GST signal expressed relative to the wild‐type (WT) BRSK1 peptide (n = 3–6). Thiophosphorylation of the S559A BRSK1 peptide was reduced compared with the WT BRSK1 peptide [F(2, 12) = 11.33, p = 0.0017, one‐way ANOVA]. B) Representative fluorescent western blot of a thiophosphorylation reaction with WT and S559A GST‐tagged BRSK1 peptides, and GST alone. C) The average ratio of pS559/FLAG signal expressed relative to the BRSK1‐WT full length FLAG‐tagged protein (n = 4). Immunoreactivity to pS559 was reduced in BRSK1‐S559A compared with BRSK1‐WT protein [F(3, 12) = 24.24, p < 0.0001, one‐way ANOVA]. D) Representative fluorescent western blot of pS559 immunoreactivity in BRSK1‐WT and BRSK1‐S559A full‐length FLAG‐tagged proteins. In B and D, the + and – indicate the presence or absence of PKCε in the reaction. ** p < 0.01 and **** p < 0.0001 by post‐hoc Sidak's multiple comparisons test in A) and C).
