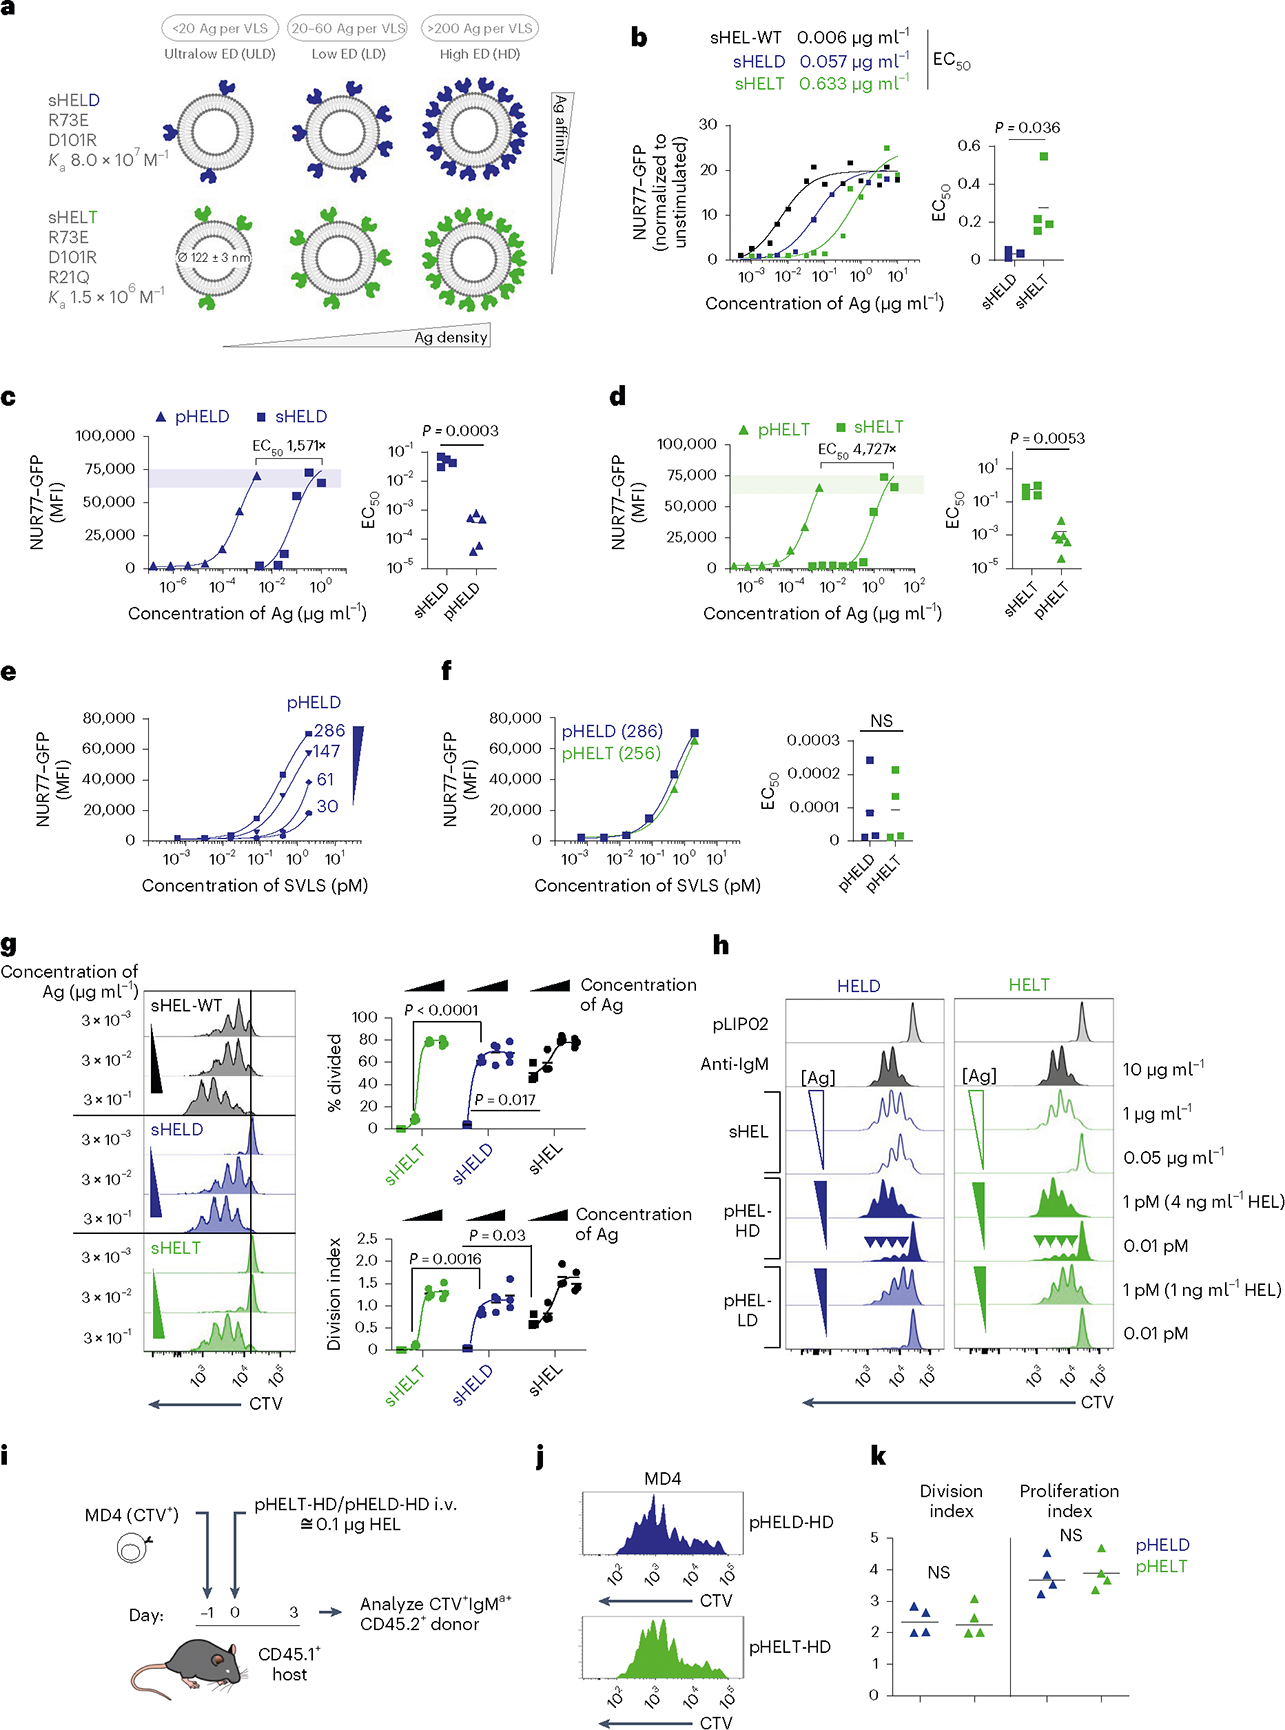
Fig. 1 |. SVLS induce highly potent B cell responses that depend on ED but not affinity.

a, Schematic of the SVLS library. b, MD4 lymphocytes with the NUR77–GFP transgenic reporter were stimulated with native wild-type sHEL (sHEL-WT) or affinity mutants sHELD and sHELT and analyzed to detect GFP MFI in B220+ cells at 24 h. Curves fit a three-parameter non-linear regression against the mean of three biological replicates per stimulus, and EC50 values correspond to these curves (left). EC50 values were also interpolated for individual biological replicates (n = 3 sHELD and n = 4 sHELT) and compared by paired two-tailed parametric t-test (right). c, Pooled splenocytes and lymphocytes from MD4 NUR77–GFP reporter mice were stimulated with either sHELD or pHELD (ED of 286) and analyzed 24 h later. Data from a representative experiment (left) were fitted with a three-parameter non-linear regression. EC50 values were interpolated from n = 4 (sHELD) and n = 5 (pHELD) biological replicates (right). d, As in c, but cells were stimulated with sHELT and pHELT (ED of 256; n = 4 sHELT and n = 6 pHELT). Data in c and d were analyzed by unpaired two-tailed parametric t-test. e, As in c, but cells were stimulated with titrated densities of HELD per particle. f, pHELT and pHELD curves from c and d are overlaid (left). EC50 values (in micrograms per milliliter) of HEL protein were interpolated from four biological replicates and compared by paired two-tailed parametric t-test (right). Data in c–f are representative of seven independent experiments; NS, not significant. g, MD4 lymphocytes were loaded with CTV vital dye and cultured with sHEL stimuli + BAFF. Representative histograms depict the CTV dilution in B220+ cells after 72 h (left). Graphs depict mean percent divided and division index calculated for three biological replicates (right) compared by parametric two-way analysis of variance (ANOVA) with a Tukey post hoc test. h, Representative histograms depict CTV dilution in live B220+ lymphocytes after 72 h with sHEL or pHEL. Inset arrowheads mark a small fraction of highly proliferated B cells. Histograms are representative of seven independent experiments. i, Experimental schematic; i.v., intravenous. j, Representative histograms depicting B220+IgMa+ donor lymphocytes in immunized hosts. k, Graphs depict division and proliferation indices for four biological replicates compared by a paired two-tailed parametric t-test.
