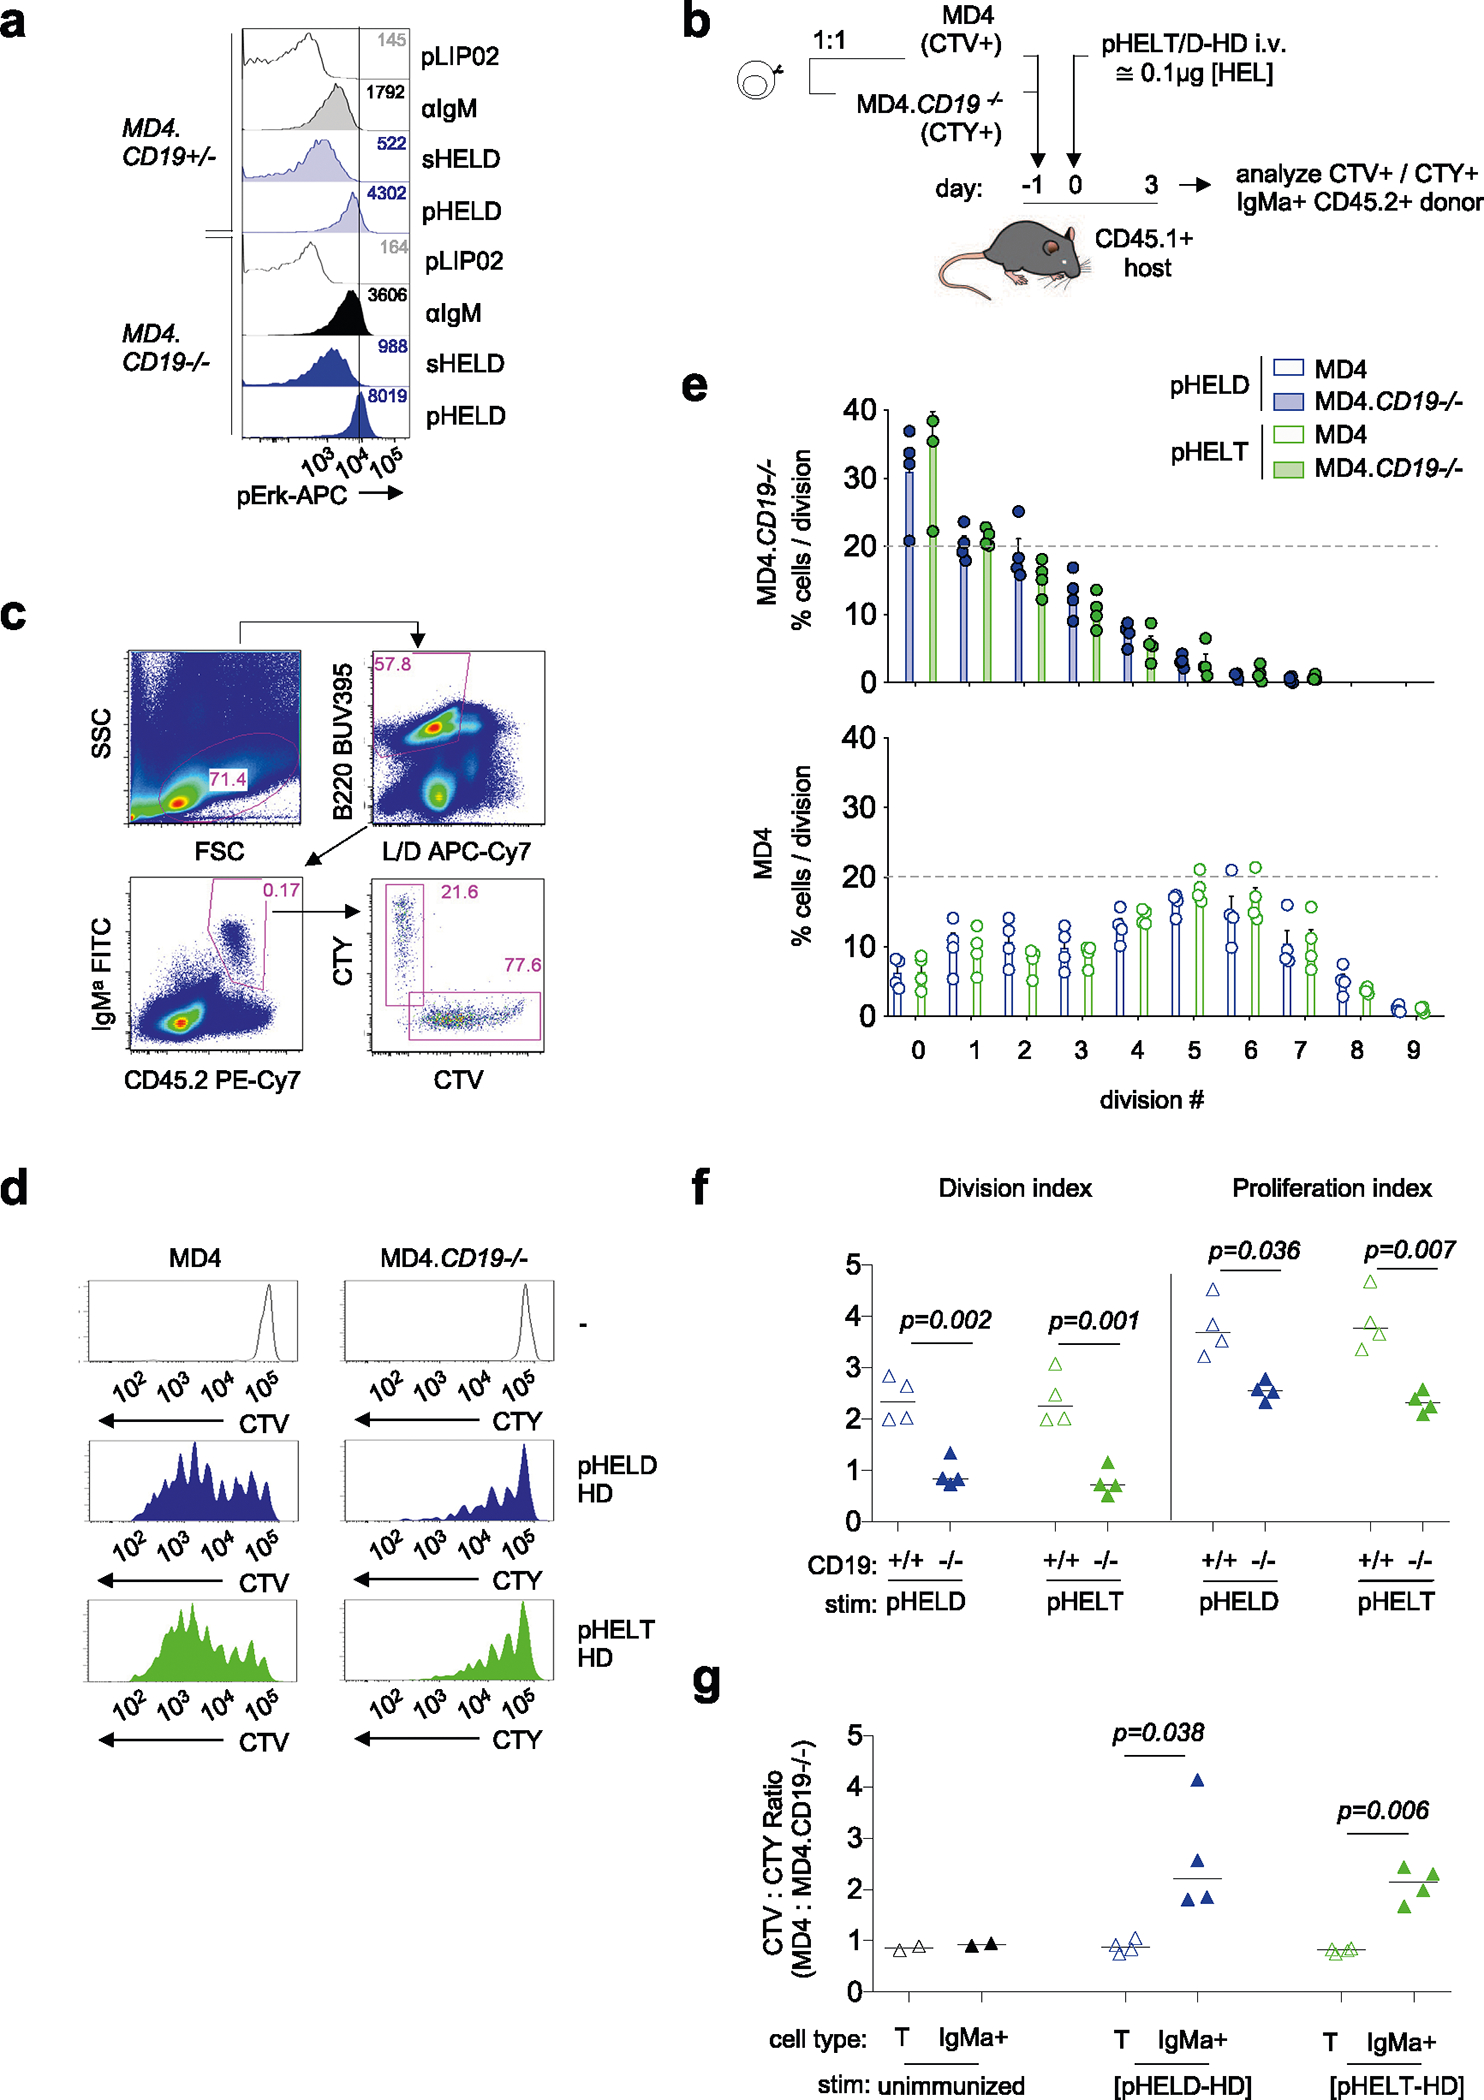
Extended Data Fig. 3 |. CD19 is dispensable in vitro but promotes B cell expansion in response to particulate Ag in vivo.

a. 20’ Phosflow assay to detect pErk in Cd19+/– or Cd19–/– MD4 splenocytes after stimulation with either control pLIP02 1pM, 10 μg/ml anti-IgM, 1 mg/ml sHELD, or 1pM pHELD-HD. Samples were co-stained with B220, CD23, and CD21 to detect B cell subsets. Histograms depict CD23+ B cells and are representative of 4 independent experiments. b-g. As in Main Fig. 1i, lymphocytes from MD4 mice were loaded with CTV and those from MD4.CD19−/− mice were loaded with CTY. Cells were mixed at a 1:1 ratio prior to adoptive transfer i.v. of 5 × 10⁶ cells into CD45.1 hosts. Time course, immunization, and d3 harvest as in Fig. 1i. MD4 data correspond to those displayed in Main Fig. 1i–k. b. Experimental schematic. c. Representative gating scheme to identify donor IgM[a]+ B cells with either CTV or CTY fluorescence; L/D, LIVE/DEAD stain. d. Representative histograms depict live IgM[a]+ donor lymphocytes in unimmunized (top) or immunized hosts. e. Graph depicts mean + SEM for % distribution of IgM[a]+ donor B cells of each genotype across cell divisions. Statistical analysis by Two-way ANOVA in supplement. f. Graphs depict division and proliferation indices. g. Ratio of CTV/CTY for donor T cells and IgM[a]+ donor B220+ B cells are plotted for each host according to immunization condition. Data in F and G depict mean of 4 biological replicates and were compared by a two-tailed paired parametric T-test.
