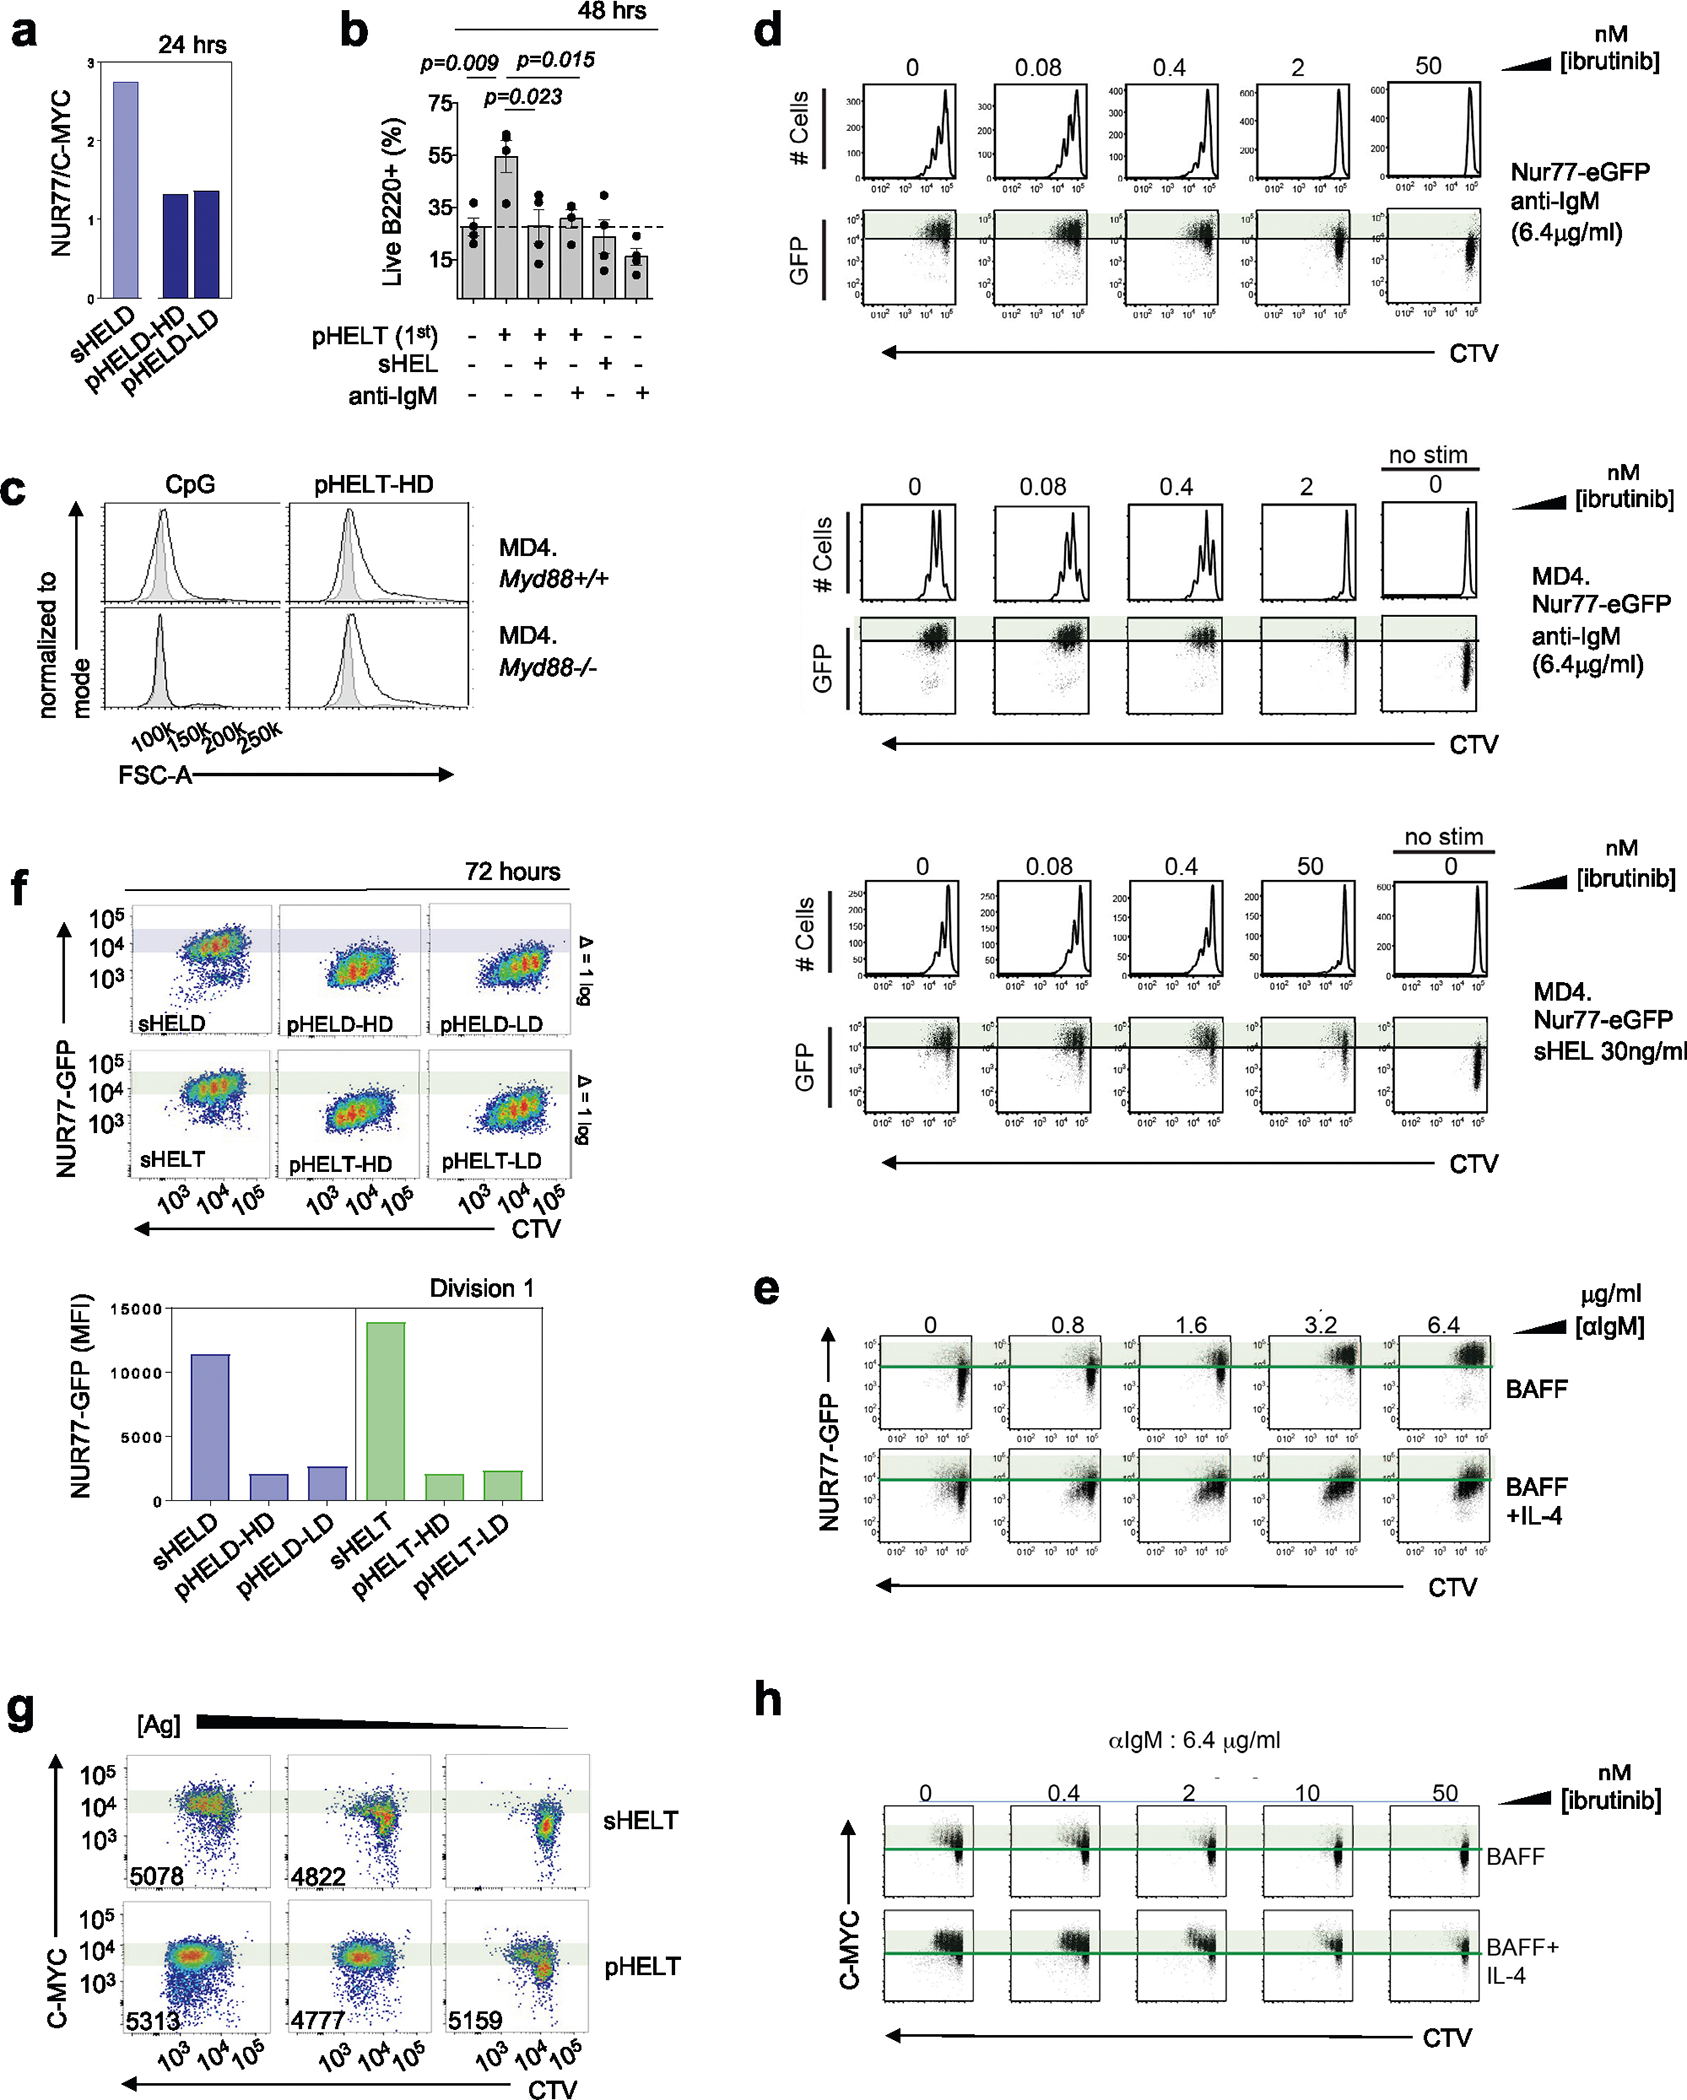
Extended Data Fig. 7 |. pHEL reduces NUR77-GFP threshold for B cell division.

a. MD4.NUR77-GFP lymphocytes were cultured for 24 hr with sHELD 1 μg/ml or 1pM pHEL. Ratio of NUR77-GFP and intra-cellular MYC among B220+ cells from a single experiment, representative of 3 independent experiments. b. MD4 lymphocytes incubated at 4 C with 1st stimulus (1pM pHELT-HD) for 15 min, followed by 2nd stimulus (or media) for 15 min. Soluble stimuli: 1 μg/ml anti-IgM or 0.1 μg/ml sHEL-WT. After 48 hr culture at 37 C without BAFF, viable frequencies of B220+ cells are plotted from 4 independent experiments, compared by a two-tailed unpaired parametric T-test. c. As in Main Fig. 8e except histograms depict B220 + FSC-A, representative of 4 independent experiments. d. CTV-loaded NUR77-GFP splenocytes (+/−MD4 Tg) cultured for 72 hr with 20 ng/ml BAFF + either 6.4 μg/ml anti-IgM or 30 ng/ml sHEL, and ibrutinib titration (0–50 nM). Plots depict CTV and GFP expression in B220+ cells, representative of 3 independent experiments. e. NUR77-GFP splenocytes cultured with 20 ng/ml BAFF as in D except with anti-IgM +/−10ng/ml IL-4. Plots depict CTV and GFP expression in B220+ cells, representative of 6 independent experiments. f. As in Main Fig. 8f,g MD4.NUR77-GFP lymphocytes were cultured with stimuli +20 ng/ml BAFF for 72 hrs: 1 μg/ml sHELD/T, 1pM pHELD/T-HD/LD. These data correspond to Fig. 8f,g but include plots and quantification for pHELD/T-LD for comparison. Shaded bars reference NUR77-GFP levels in dividing B cells stimulated with sHELD/sHELT. (Bottom) Quantification of NUR77-GFP levels in the first division. Data are representative of 5 independent experiments. g. As in Main Fig. 8h, but comparing intra-cellular MYC among CTV-loaded B220+ cells after 72 hr culture: pHELT (1, 0.1, 0.01pM) and sHELT (500, 50, 5 ng/ml). Inset values: MFI of division 1 cells. Data are representative of 3 independent experiments. h. As in E, but cultured with anti-IgM(6.4 μg/ml) and titration of ibrutinib, comparing MYC among CTV-loaded B220+ cells after 72 hr culture. Data are representative of 6 independent experiments.
