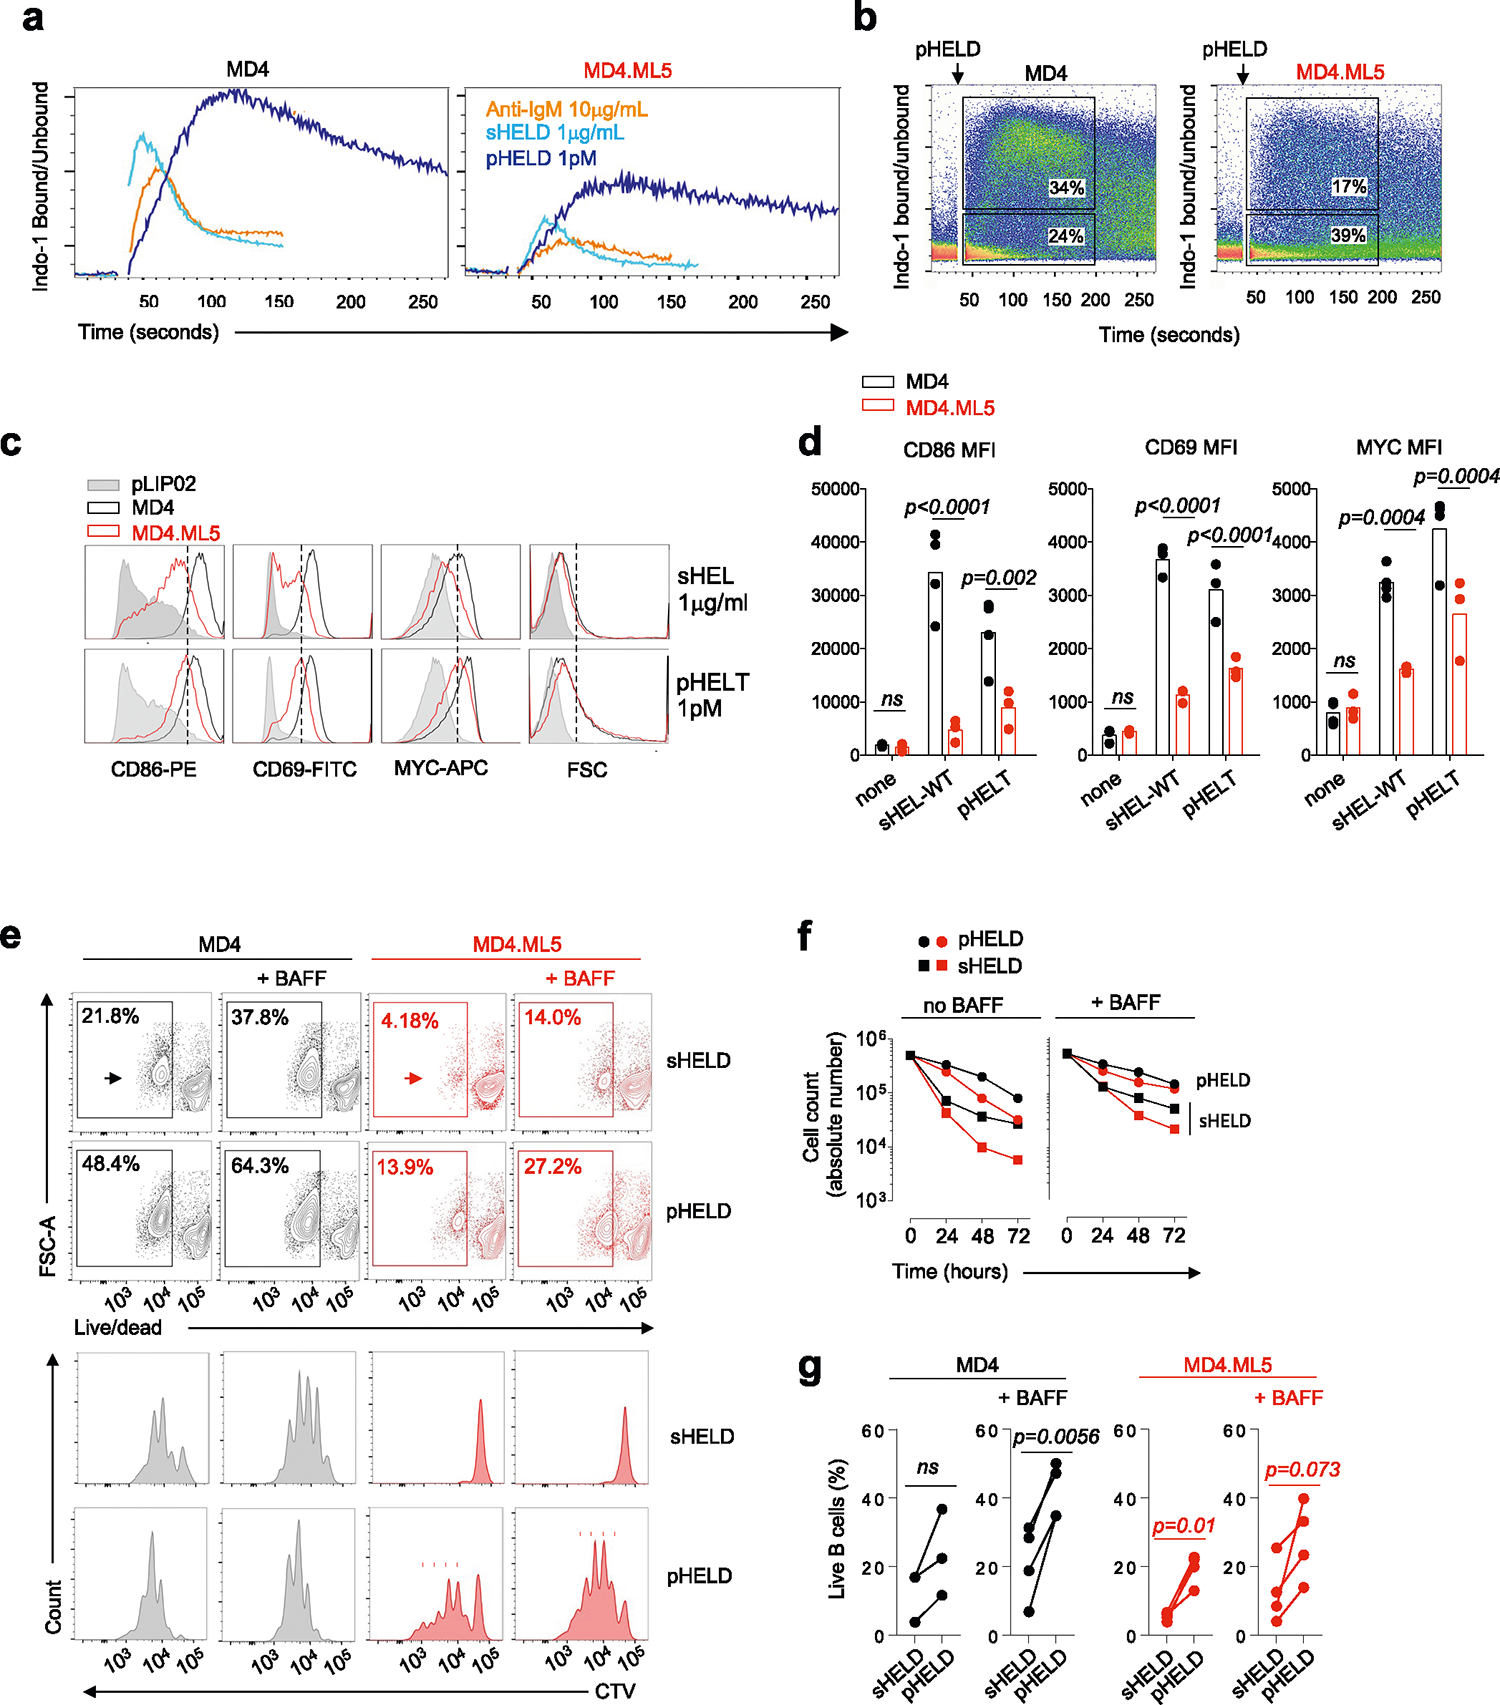
Extended Data Fig. 8 |. pHEL partially activates anergic B cells.

a, b. As in Main Figs. 2e,f and 3c except cells from MD4 or MD4.ML5 mice were stimulated with indicated reagents: anti-IgM 10 μg/ml, sHELD 1 μg/ml, or pHELD-HD (ED 286) 1 pM. Indo-1 ratio is shown on a linear scale. Gated in B are corresponding time gates to capture fraction of responding or non-responding B cells. Data are representative of 3 independent experiments. c, d. As in 8 A, B except pooled splenocytes and lymphocytes from MD4 (naïve) or MD4.ML5 (anergic) mice were incubated with indicated stimuli for 24 hours (sHEL-WT 1 μg/ml or pHELT-HD 1pM). Histograms and graphs depict MFI of CD86, CD69, or intra-cellular MYC in live B220 B cells. Graphs depict data and mean from and histograms are representative of 3 (MD4/ML5) or 4 (MD4) independent experiments. MD4 data in graphs corresponds to a subset of data plotted in Fig. 8b. Data were compared by two-tailed unpaired parametric t-test with Holm-Sidak correction. e-g. Viable frequencies of CTV-loaded MD4 (naïve) or MD4.ML5 (anergic) lymph node B cells in culture at 72-hours post-stimulation with sHELD/T and pHELD/T in the presence or absence of 20 ng/ml BAFF assessed via live/dead indicator dye. E. Representative plots depict gating to identify live B cells from total B220+ cells at 72 hr with corresponding histograms below depicting vital dye dilution of live B220+ cells at the same time point. Data are representative of 4 independent experiments. F. Absolute live B cell counts at sequential time points assessed using counting beads from a single experiment. G. Graphs depict %live B220 + B cells from total lymphocyte gate. Each datapoint is a sample from 4 independent experiments (except N = 3 for MD4 with no BAFF) independent experiments; lines connect samples from the same experiment. Groups were compared by a two-tailed paired parametric T-test.
