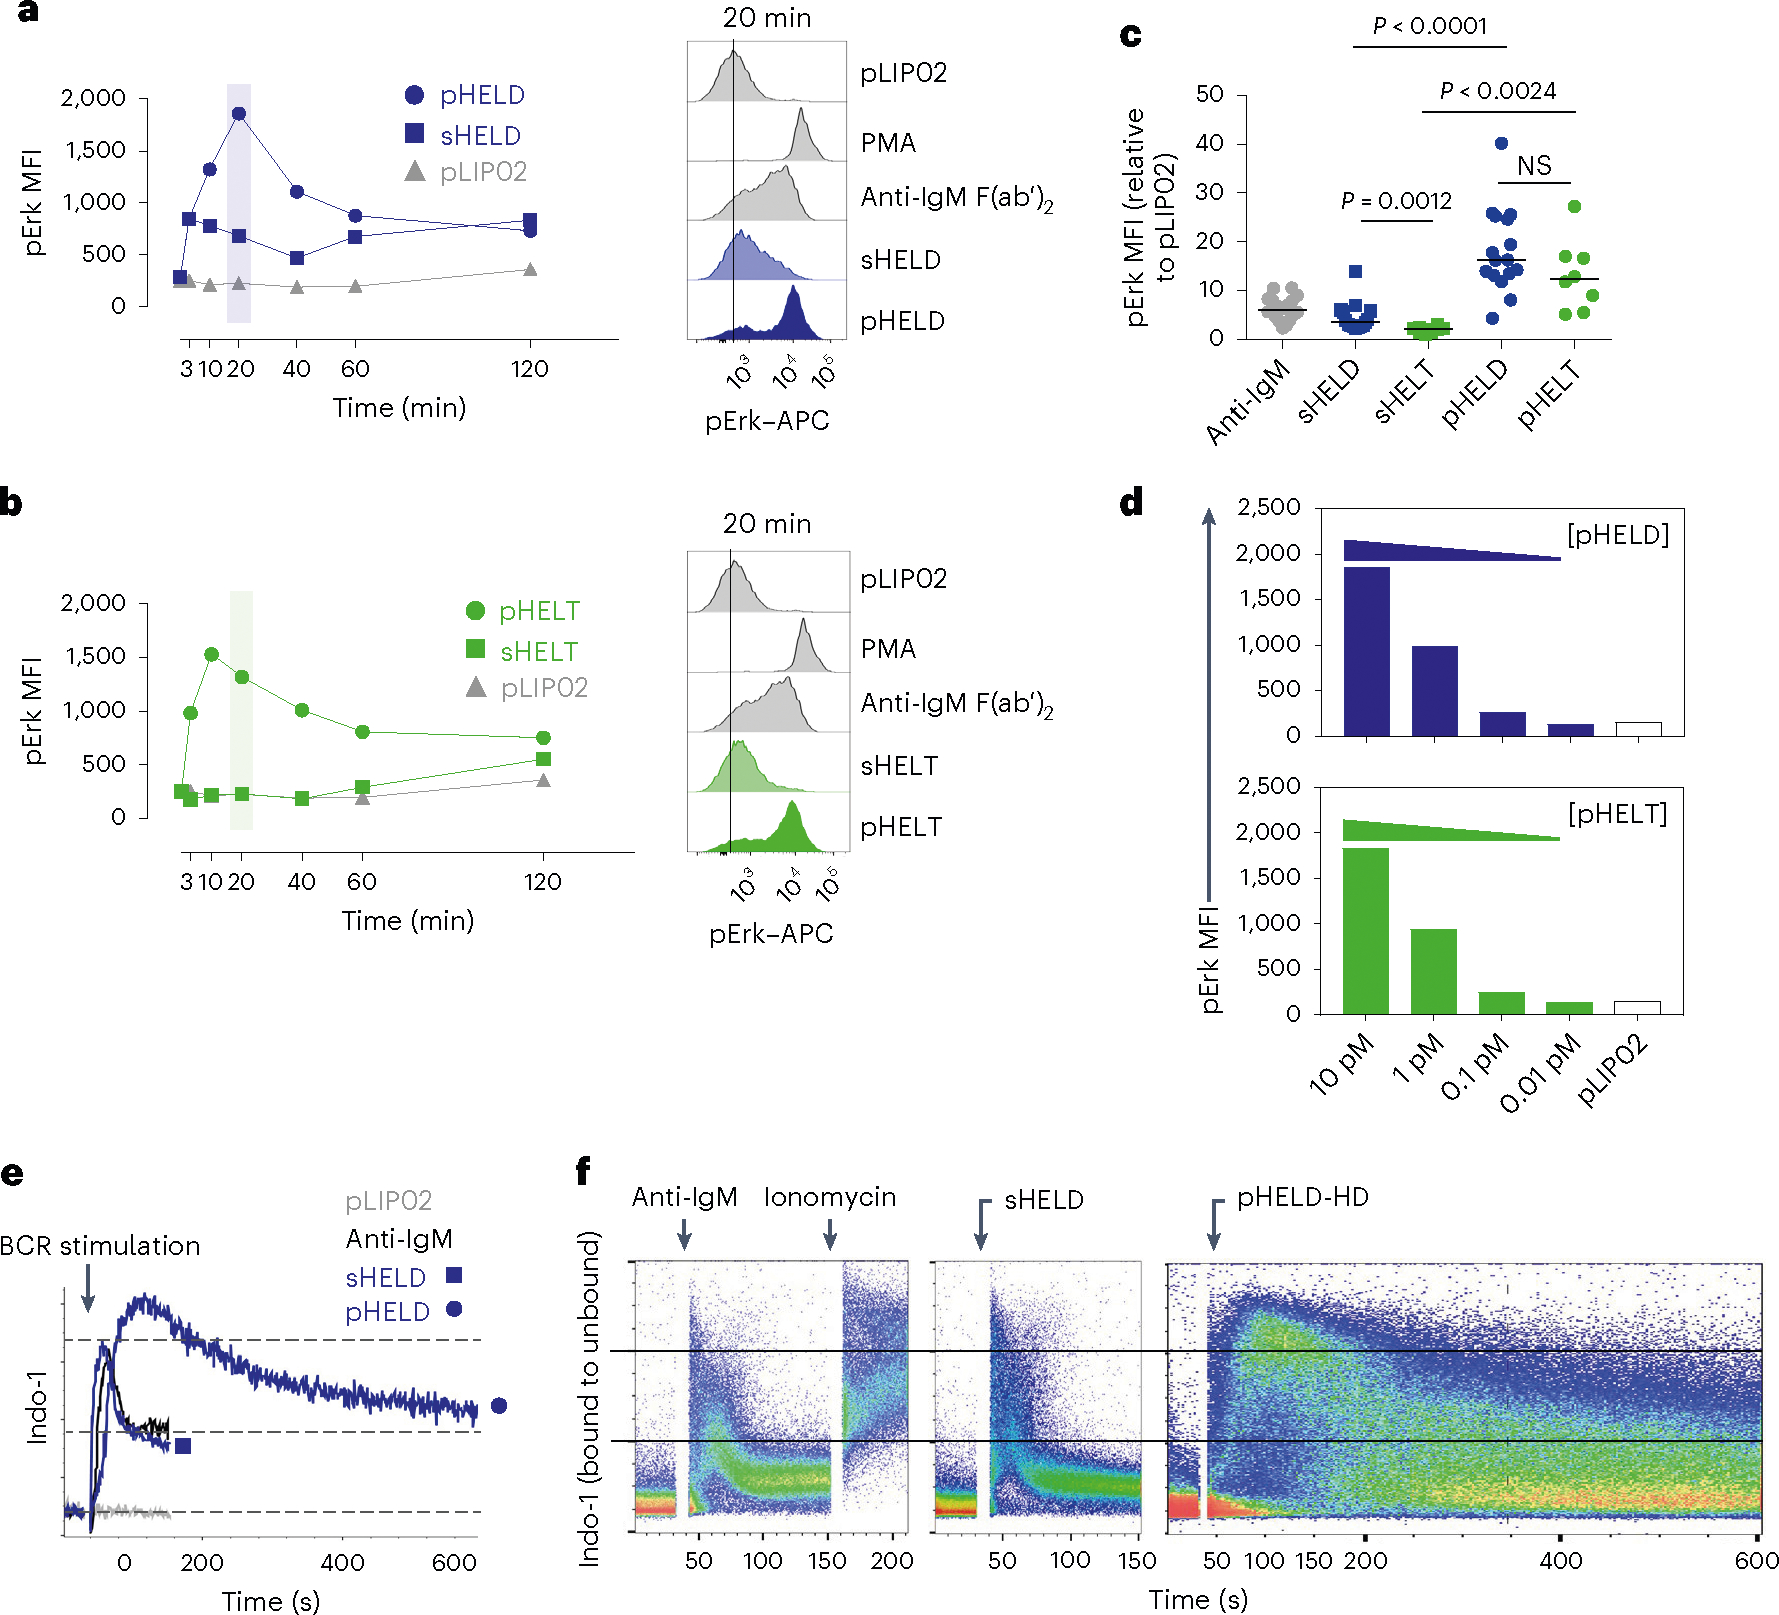
Fig. 2 |. pHEL triggers robust signaling downstream of the BCR that is insensitive to epitope affinity.

a,b, MD4 splenocytes were stimulated over a time course of 120 min, fixed and permeabilized, and intracellular pErk was measured by flow cytometry (left). Stimuli included 10 pM pLIP02 (naked liposome), 10 μg ml−1 anti-IgM, pHELD (a) or pHELT (b) (EDs of 286 and 256, respectively; 1 pM liposome ≅ 4 ng ml−1 HEL protein) and 1 μg ml−1 sHELT or sHELD. The selected doses of sHEL and pHEL were equipotent for the induction of NUR77–GFP at 24 h (see Fig. 1c,d). Graphs (left) and histograms (right) depict pErk in B220+ cells from a single time course and are representative of three independent experiments; PMA, phorbol 12-myristate 13-acetate. c, B cell pErk MFI after 20 min of stimulation; each point represents an independent experiment, and data are pooled from 16 (pHELD) or 8 (pHELT) experiments depending on stimulus. Separate groups are depicted in a single graph for convenience. Prespecified groups were compared by a paired two-tailed parametric t-test. The mean is depicted. d, As in a and b, but splenocytes were stimulated with decreasing concentrations of either pHELT or pHELD for 20 min. Data plotted are from a single experiment and are representative of four independent experiments. e,f, Splenocytes and lymphocytes from MD4 mice were pooled, loaded with Indo-1 calcium indicator dye, stained to detect B220+ B cells and stimulated as in a. Calcium entry was detected in real time by flow cytometric detection of bound and unbound Indo-1 fluorescence for 2–10 min (e). The ratio of bound to unbound Indo-1 fluorescence over time is plotted as population mean or for individual cells (f). Data are representative of eight independent experiments.
