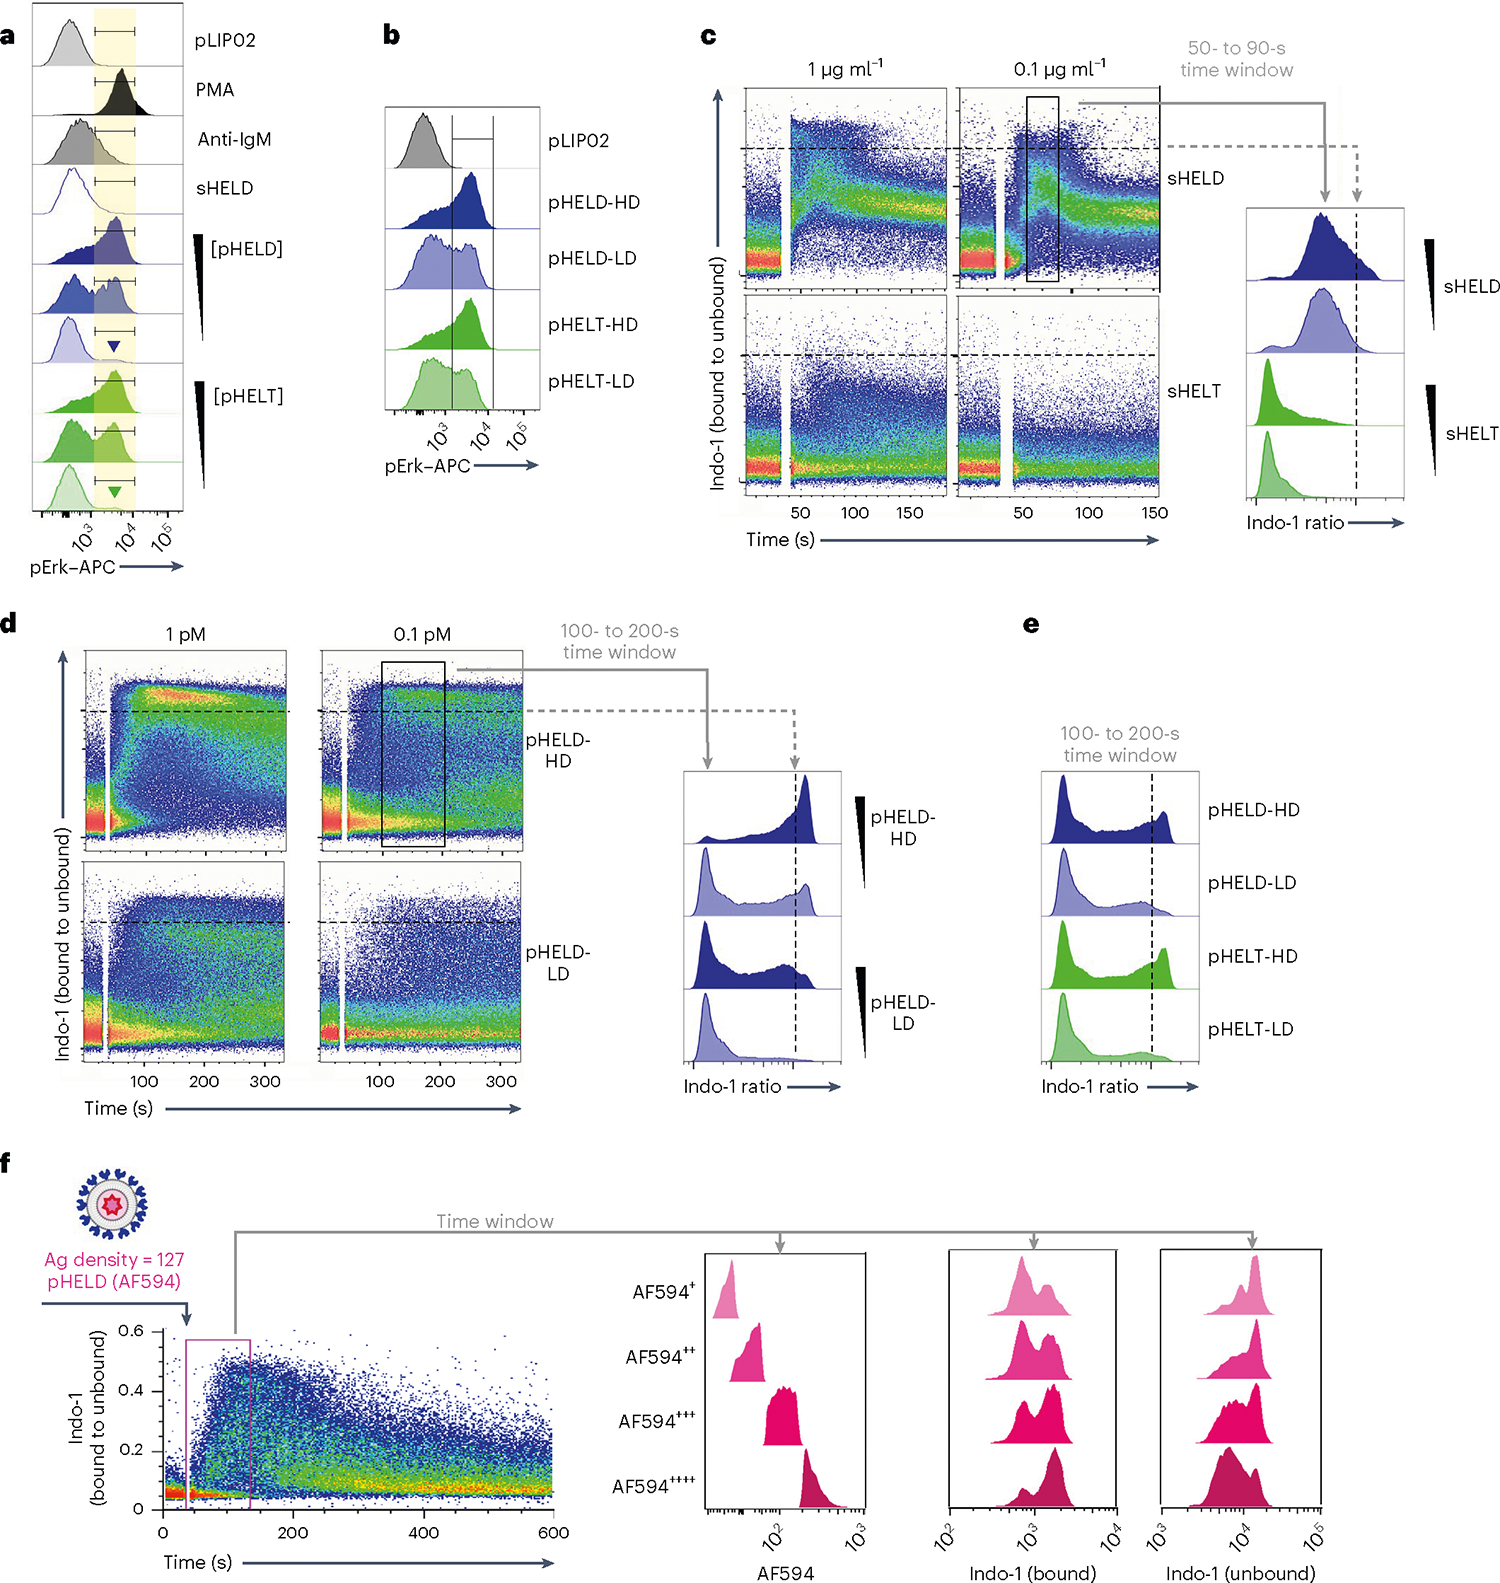
Fig. 3 |. Particulate Ag triggers bimodal signaling that is sensitive to dose and ED but not epitope affinity.

a, As in Fig. 2a,b, but splenocytes were stimulated with decreasing concentrations of either pHELT or pHELD (10 pM, 1 pM and 0.1 pM). Samples correspond to the MFI quantification in Fig. 2d. Inset goal posts gate on a subset of cells with maximal pErk signal. b, As in a, but splenocytes were stimulated with 10 pM SVLS carrying either high-density (HD) or low-density (LD) HELD or HELT (EDs of 286, 256, 61 and 64, respectively). Data in a and b are representative of four independent experiments. c–e, Pooled splenocytes and lymphocytes from MD4 mice were loaded with Indo-1 calcium indicator dye, stained with surface markers to detect B220+ cells and stimulated with sHELD/sHELT (1 and 0.1 μg ml−1; c), 1 or 0.1 pM high- or low-density pHELD (EDs of 286 and 23, respectively; d) or high- or low-density pHELD/pHELT (EDs of 286/256 and 61/64, respectively; e). Calcium entry was assessed by flow cytometry for the indicated times. Plots depict the geometric mean of the fluorescence ratio of bound to unbound Indo-1 in individual cells over time (in seconds) on a log scale. Histograms display the fluorescence ratio of bound to unbound Indo-1 gated on a defined time window to capture peak cytosolic calcium for each type of stimulus. Data in c–e depict the same Indo-1 axis/scale, and dashed black lines mark the corresponding value across dot plots and histograms for comparison. Data are representative of at least three independent experiments depending on stimuli. f, As in Fig. 2f, except that cells were stimulated with 1 pM fluorescent pHELD (AF594), as characterized in Extended Data Fig. 1h,i, and were also gated to detect B cell subsets, as in Extended Data Fig. 2h,i. Right-hand histograms depict CD23+CD21lo B cells subgated according to AF594 fluorescence during an early time window. Bound and unbound Indo-1 fluorescence histograms for each subgate are shown. Data are representative of three independent experiments.
