
Fig. 5 |. pHEL triggers robust signal amplification downstream of the BCR.
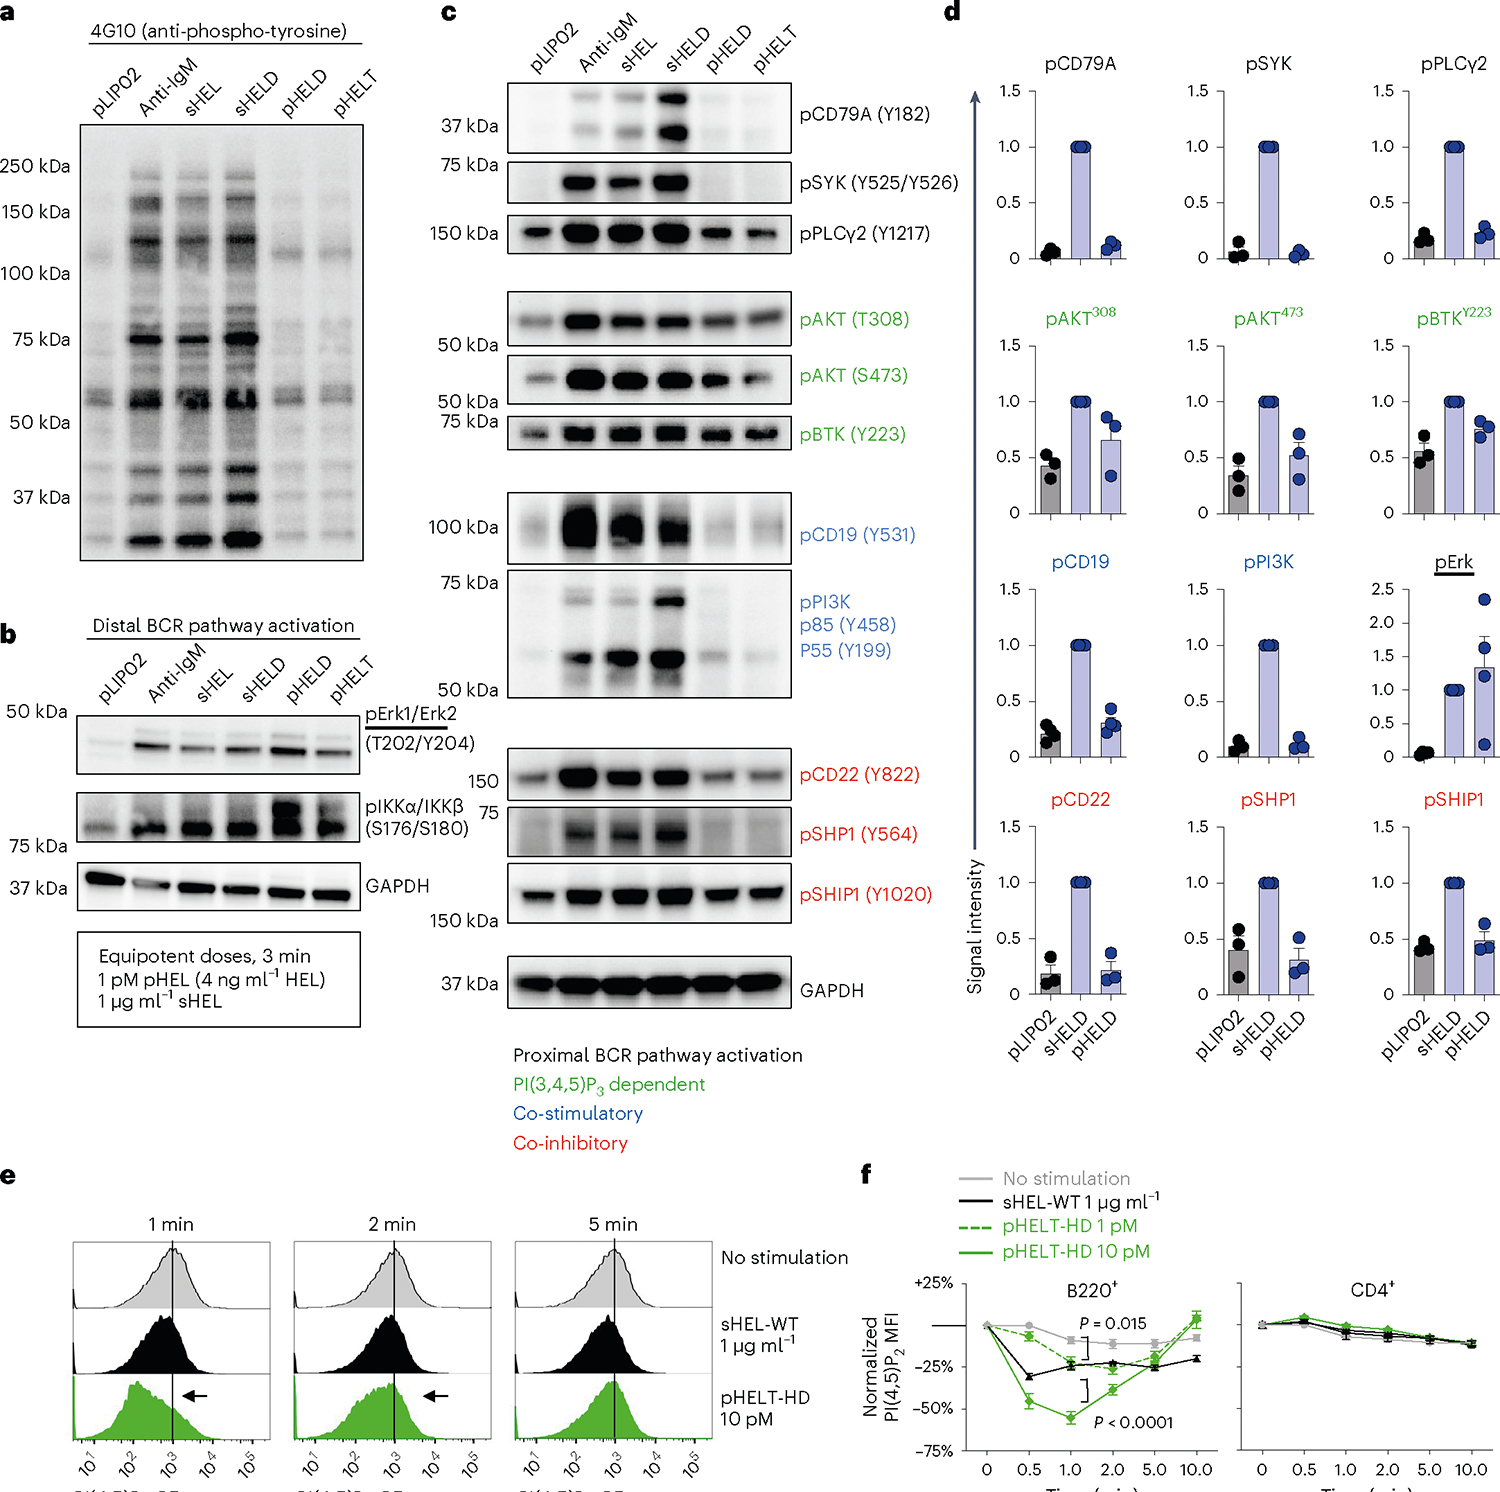
a–c, MD4 splenocytes and lymphocytes were pooled, and B cells were isolated by benchtop negative selection. B cells were stimulated for 3 min at 37 °C with naked liposome (1 pM pLIP02), 10 μg ml−1 anti-IgM, 1 μg ml−1 sHEL-WT/sHELD or 1 pM pHELD/pHELT (high ED of 250–290). Lysates were analyzed by western blotting to detect total phospho-tyrosine (4G10; a) or specific phospho-species in the BCR signaling cascade (b and c). In b and c, GAPDH (bottom) is shown as a loading control because a common pool of cells was used for all stimulation conditions. Images depict blots performed with a single set of lysates representative of three to six independent experiments depending on blotting antibody with corresponding quantification across biological replicates in d. d, Summary data of phosphoprotein quantification from n = 3 independent experiments except for pErk and pCD19 (n = 4). Quantification shows mean band intensity normalized to the sHEL condition for each blot + s.e.m. In each experiment, blots were probed for GAPDH as depicted in b and c to confirm accurate loading. Groups were compared by paired and unpaired two-tailed parametric t-tests applied to raw unnormalized band intensity (see Source Data for statistical analysis and individual P values). e,f, MD4 lymphocytes were stimulated with medium alone, sHEL or pHELT-HD for different time points (0–10 min) and fixed, permeabilized and stained to identify B220+ and CD4+ populations as well as intracellular PI(4,5) P2 abundance. Histograms depict PI(4,5)P2 expression in B220+ B cells in response to distinct stimuli across time points (e). Graphs depict PI(4,5)P2 MFI (normalized to t = 0.5 min condition without stimulation) in B220+ and CD4+ lymphocytes across stimuli and time points from n = 6 biological replicates across three independent experiments (except n = 4 for the 1 pM pHELT dose; f). Graphs show mean ± s.e.m. Samples at the 1- to 10-min time points were compared by two-way ANOVA with a Tukey post hoc correction for multiple comparisons.