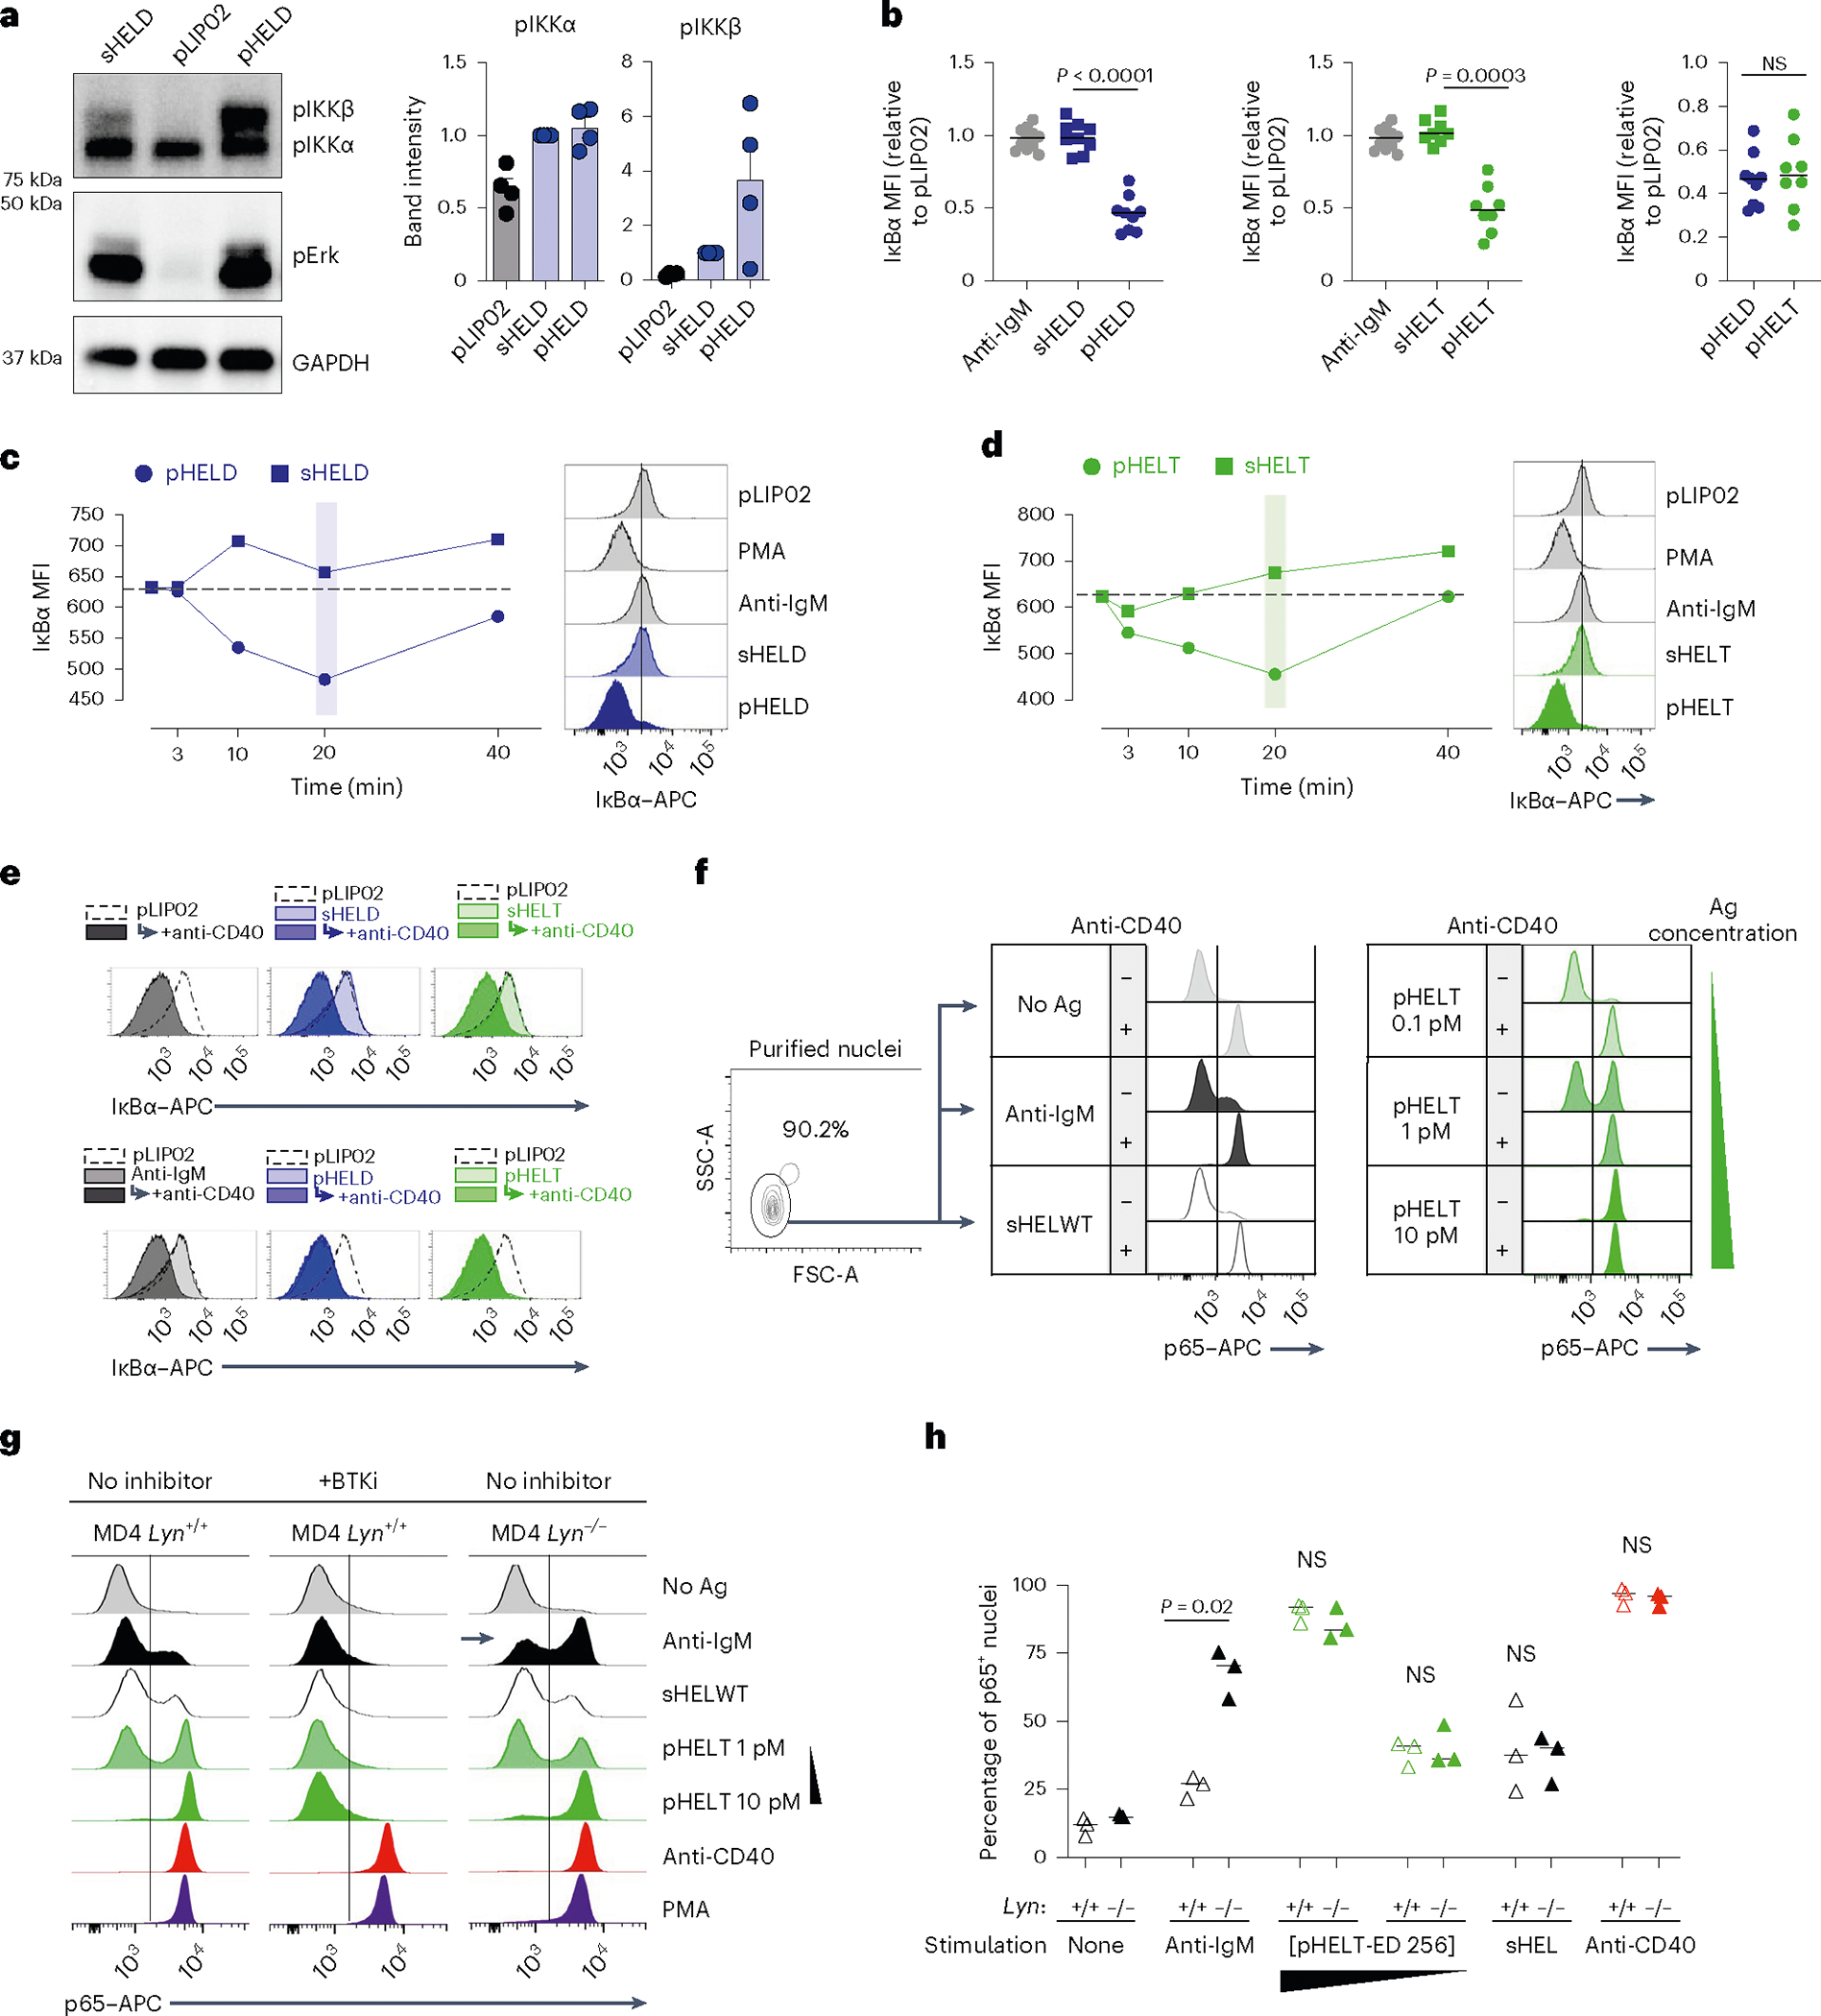
Fig. 7 |. pHEL triggers highly robust NF-κB signaling that mimics co-stimulation.

a, Lysates were prepared as in Fig. 5 and were probed for pIKKα/IKKβ, pErk and GAPDH loading control as shown in Fig. 5b. Representative western blot images are shown. Quantification (right) shows band intensity normalized to sHEL for pIKKα and pIKKβ and depicts mean + s.e.m. for n = 4 independent experiments. Groups were compared by paired and unpaired two-tailed parametric t-tests applied to raw unnormalized band intensity (see Source Data for statistical analysis and individual P values). b–d, As in Fig. 2a,b, MD4 splenocytes were stimulated and analyzed by Phosflow for IκBα degradation. Graphs (b) and histograms (c and d) depict IκB MFI in B220+ cells at 20 min. Each data point represents an individual experiment pooled from n = 11 (anti-IgM), n = 9 (HELD) or n = 8 (HELT) independent experiments. Groups were compared by a two-tailed paired parametric t-test. Mean values are depicted. e, B cells purified by negative selection were stimulated for 20 min in the presence or absence of anti-CD40 (1 μg ml−1) as well as anti-IgM (10 μg ml−1), sHELD/sHELT (1 μg ml−1) or pHELD-HD/pHELT-HD (1 pM), and IκBα was measured. The dashed overlay on the histogram shows the internal negative control. Light-shaded histograms show the BCR stimulus condition alone, and dark-shaded histograms show the BCR stimulus condition + anti-CD40. f, As in e, but nuclei were purified following stimulation and interrogated for p65 nuclear translocation. Data in e and f are representative of three independent experiments. g, Nuclear p65 translocation was assessed in stimulated B cells as in f except either MD4 or MD4 Lyn−/− B cells were studied. In addition, stimuli were applied for 20 min following a 15-min preincubation with or without BTK inhibitor (100 nM ibrutinib). Data are representative of two independent experiments for BTK inhibitor pretreatment and for three independent experiments for the MD4 Lyn−/− comparison. h, Data in g are graphed to depict the percentage of p65+ nuclei as gated in g. The graph depicts data from three independent experiments; data were compared by two-tailed paired parametric t-test. Mean values are depicted; [pHELT-ED 256], concentration of pHELT (ED of 256).
