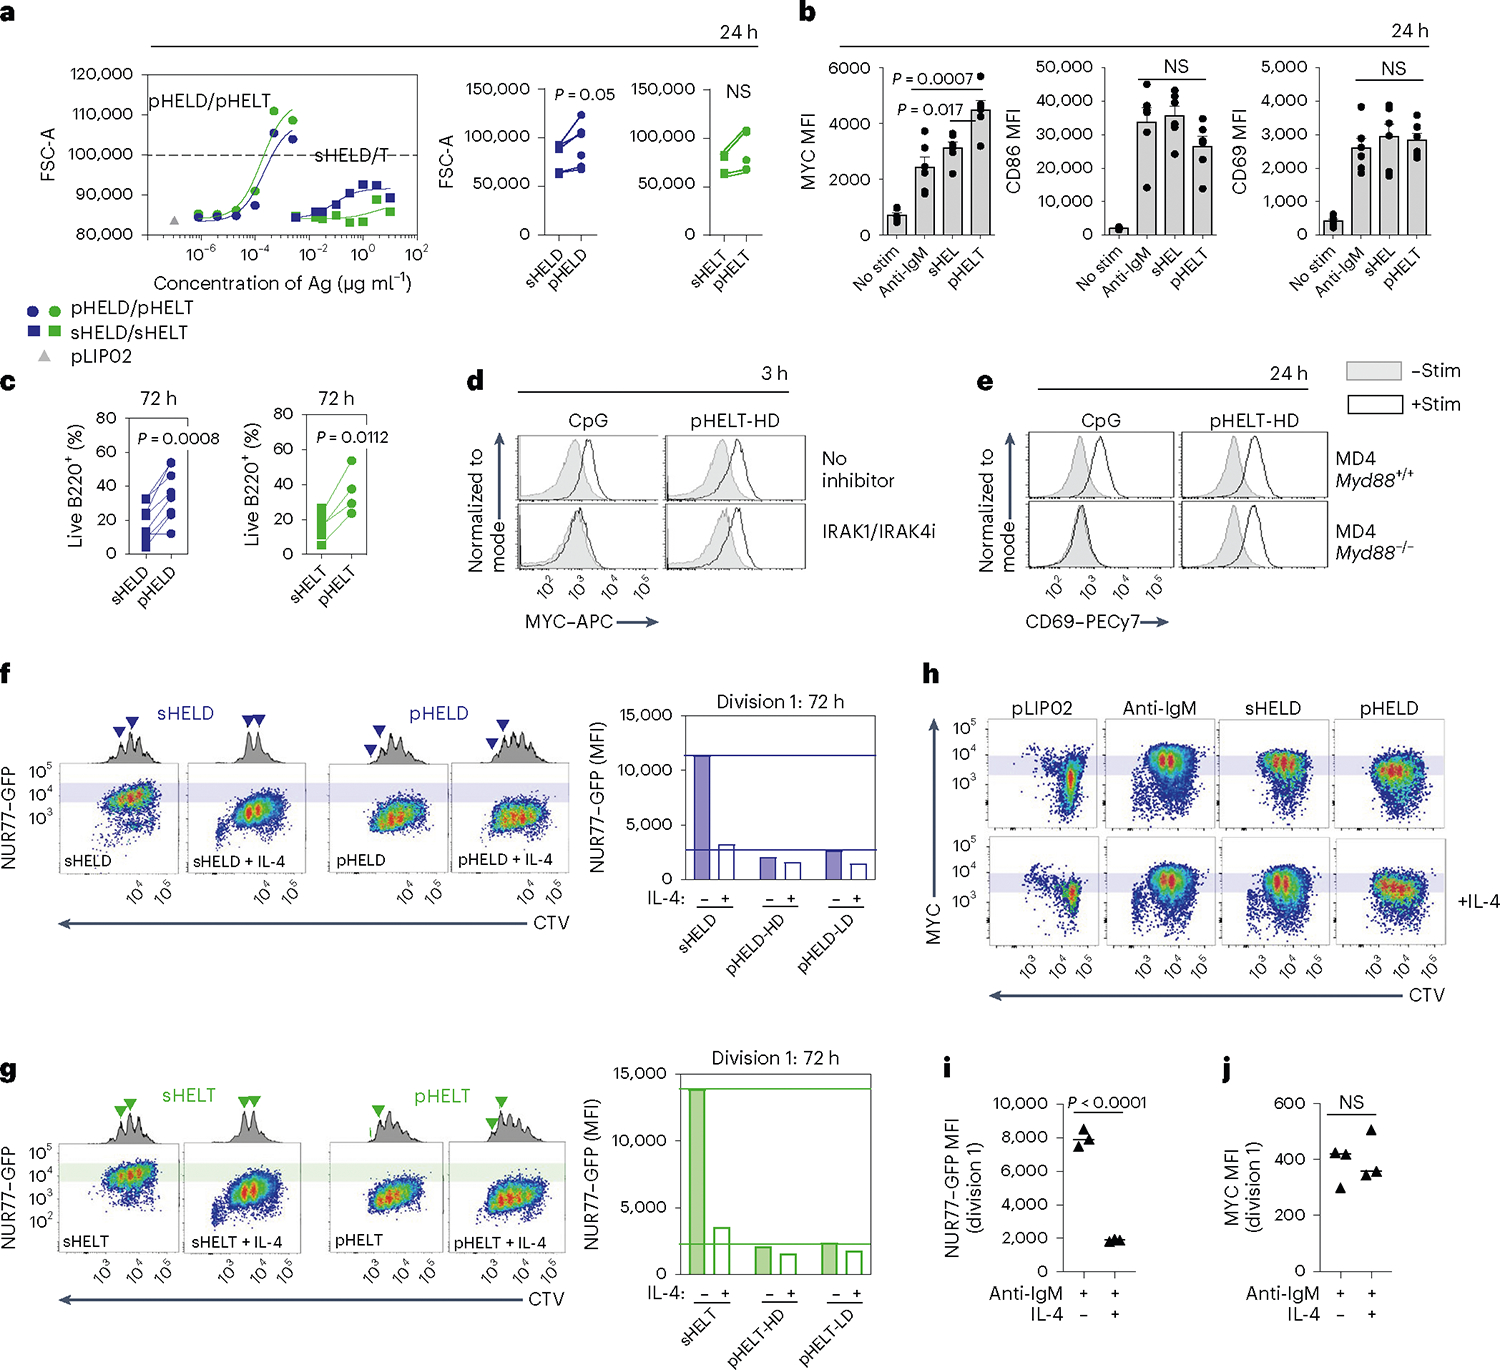
Fig. 8 |. pHEL triggers robust proliferation with a lower NUR77–GFP threshold than soluble stimuli.

a,b, Pooled splenocytes and lymphocytes from MD4 mice were stimulated for 24 h. a, Dose–response curves for FSC-A MFI of B220+ cells (left) are representative of four independent experiments. Summary data depict 1 μg ml−1 sHELD/sHELT and 1 pM pHELD-HD/pHELT-HD from n = 6 experiments (n = 5 for sHELT) and are compared by two-tailed paired parametric t-test. b, Mean MFI + s.e.m. of intracellular MYC and surface expression of CD69 and CD86 in B220+ cells pooled from six independent experiments and compared by one-way ANOVA with Tukey’s multiple comparisons test; stim, stimulation. c, Viable frequencies of MD4 lymph node B cells in culture at 72 h with BCR stimuli (as in a) + BAFF. Data are pooled from n = 8 independent experiments (n = 7 for sHELT and n = 4 for pHELT) and are compared by two-tailed paired parametric t-test. d, As in Fig. 4a, but cells were treated with IRAK1/IRAK4 inhibitor and the indicated stimuli (2.5 μM CpG and 1 pM pHELT-HD) for 3 h and stained to detect intracellular MYC. Histograms are representative of two independent experiments. e, As in b, except either Myd88+/+ or Myd88−/− MD4 cells were cultured. Histograms are representative of three independent experiments. f,g, MD4 NUR77–GFP reporter lymph node cells were labeled with CTV and cultured as in c with HELD (f) or HELT (g) with stimuli (as in c) for 72 h with BAFF ± IL-4. Histograms show division peaks, and arrowheads denote changes in division peak intensity between IL-4-treated and untreated B220+ cells. Shaded bars in plots reference NUR77–GFP levels in dividing B cells stimulated with soluble Ag. Right, quantification of NUR77–GFP levels in the first division peak. Data are representative of four independent experiments. h, As in f, but cells were stained to detect intracellular MYC. Plots are representative of three independent experiments. i,j, Quantification of NUR77–GFP levels (i) and MYC (j) in the first division peak of polyclonal NUR77–GFP reporter B cells cultured with anti-IgM (6.4 μg ml−1) ± IL-4 as in Extended Data Fig. 7e,h. The graph shows the mean values of three biological replicates compared by two-tailed unpaired parametric t-tests. Data are representative of six independent experiments.
