
Fig. 1.
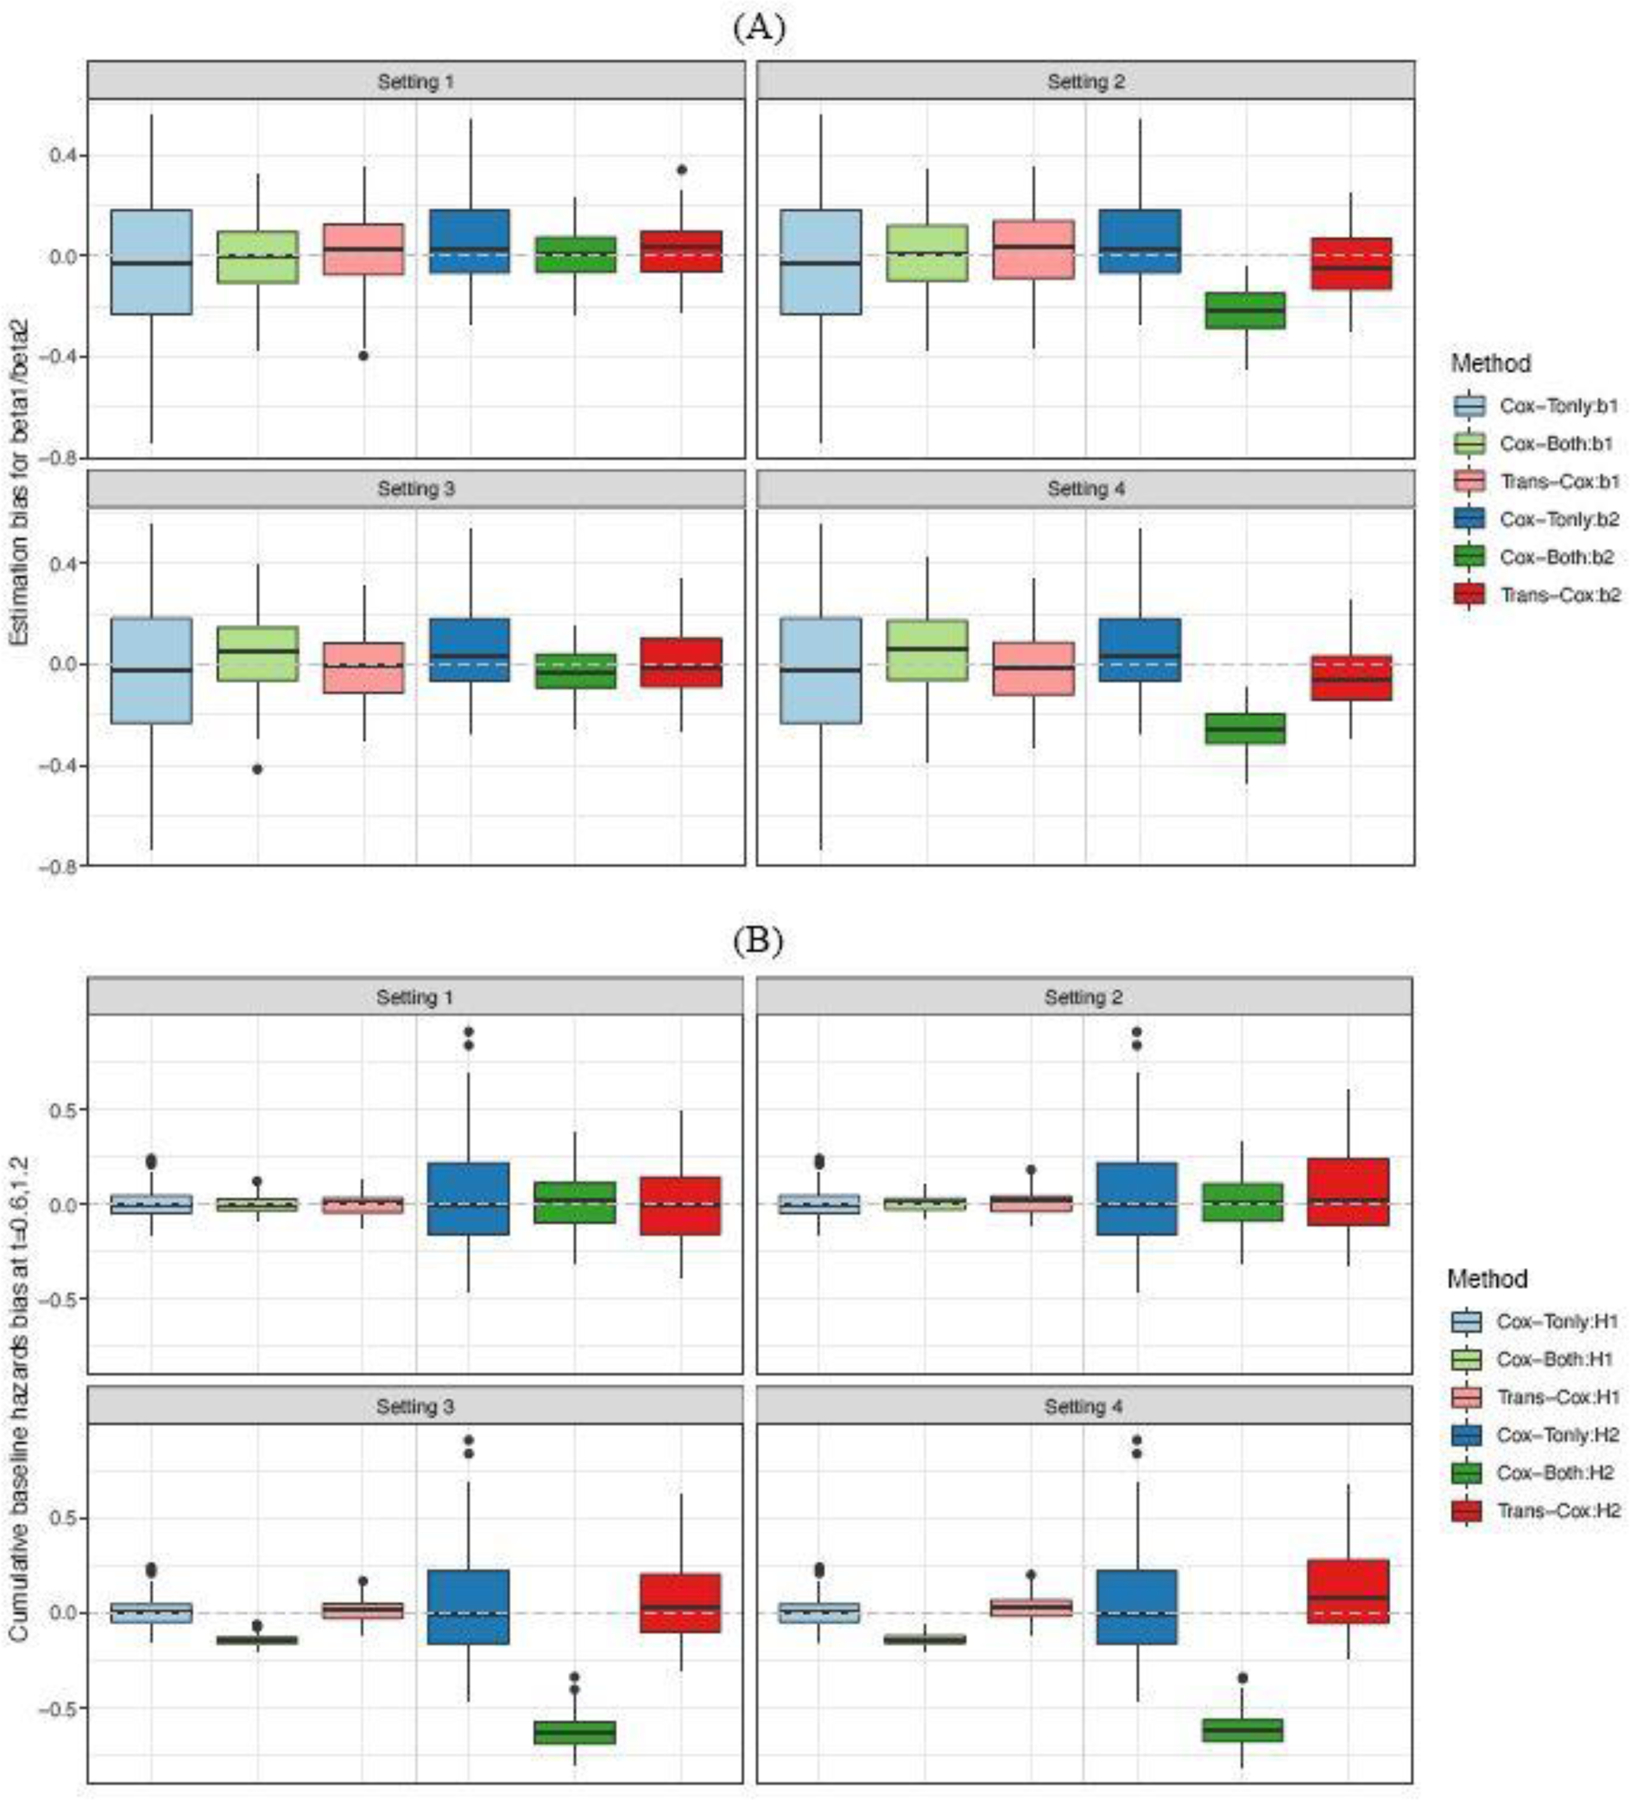
Estimation biases for coefficients , , and (Panel A), as well as cumulative baseline hazards at times 0.6 and 1.2 (Panel B) over 100 Monte Carlo simulations. and . The dotted gray line shows the place where bias equals zero.
Official websites use .gov
A
.gov website belongs to an official
government organization in the United States.
Secure .gov websites use HTTPS
A lock (
) or https:// means you've safely
connected to the .gov website. Share sensitive
information only on official, secure websites.
Estimation biases for coefficients , , and (Panel A), as well as cumulative baseline hazards at times 0.6 and 1.2 (Panel B) over 100 Monte Carlo simulations. and . The dotted gray line shows the place where bias equals zero.